We're Here to Help!
Reach Out to Us
Email: hello@caspia.co.uk
Phone: +44 744 719 8083
Customer Support
We are always here to assist you. For support, please contact us at support@caspia.co.uk
Postal Address
Caspia AI and Data Consultancy
Kimpton Rd, London-Luton
LU2 0LA, United Kingdom.
Claim Your Complimentary Strategy Call

Inbox Data Insights (IDI)
Turn email chaos into intelligence. Analyze, visualize, and secure massive volumes of inbox data with Inbox Data Insights (IDI) by Caspia.

Data Security
Safeguard your data with our four-stage supervision and assessment framework, ensuring robust, compliant, and ethical security practices for resilient organizational trust and protection.

Data and Machine Learning
Harness the power of data and machine learning with our four-stage supervision and assessment framework, delivering precise, ethical, and scalable AI solutions for transformative organizational impact.

AI Data Workshops
Empower your team with hands-on AI data skills through our four-stage workshop framework, ensuring practical, scalable, and ethical AI solutions for organizational success.

Data Engineering
Architect and optimize robust data platforms with our four-stage supervision and assessment framework, ensuring scalable, secure, and efficient data ecosystems for organizational success.

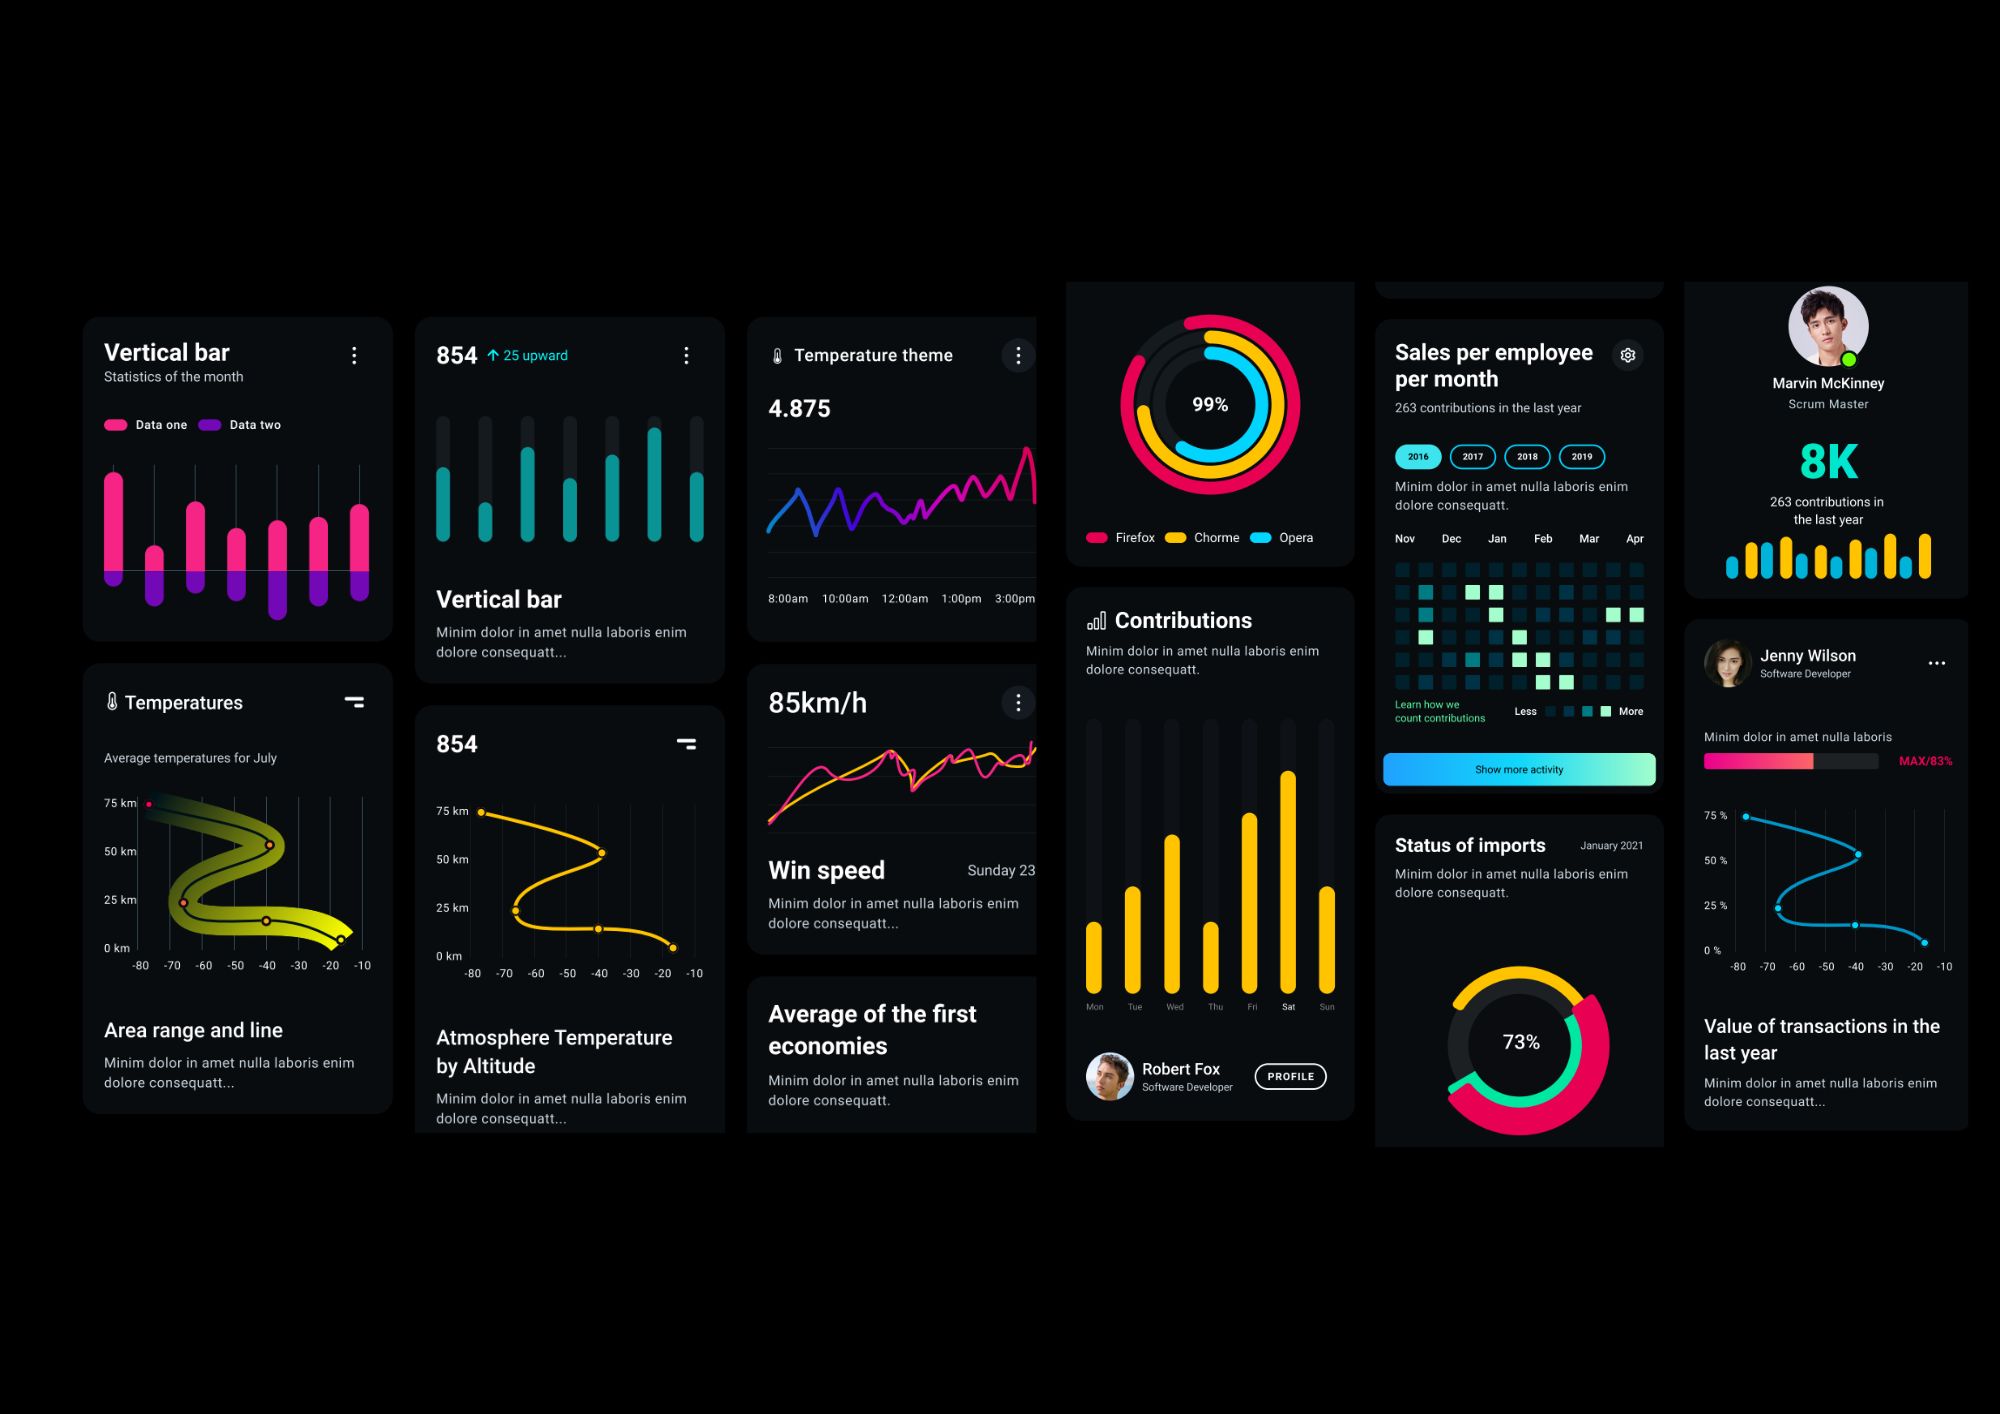
Data Visualization
Harness the power of visualization charts to transform complex datasets into actionable insights, enabling evidence-based decision-making across diverse organizational contexts.

Insights and Analytics
Transform complex data into actionable insights with advanced analytics, fostering evidence-based strategies for sustainable organizational success.

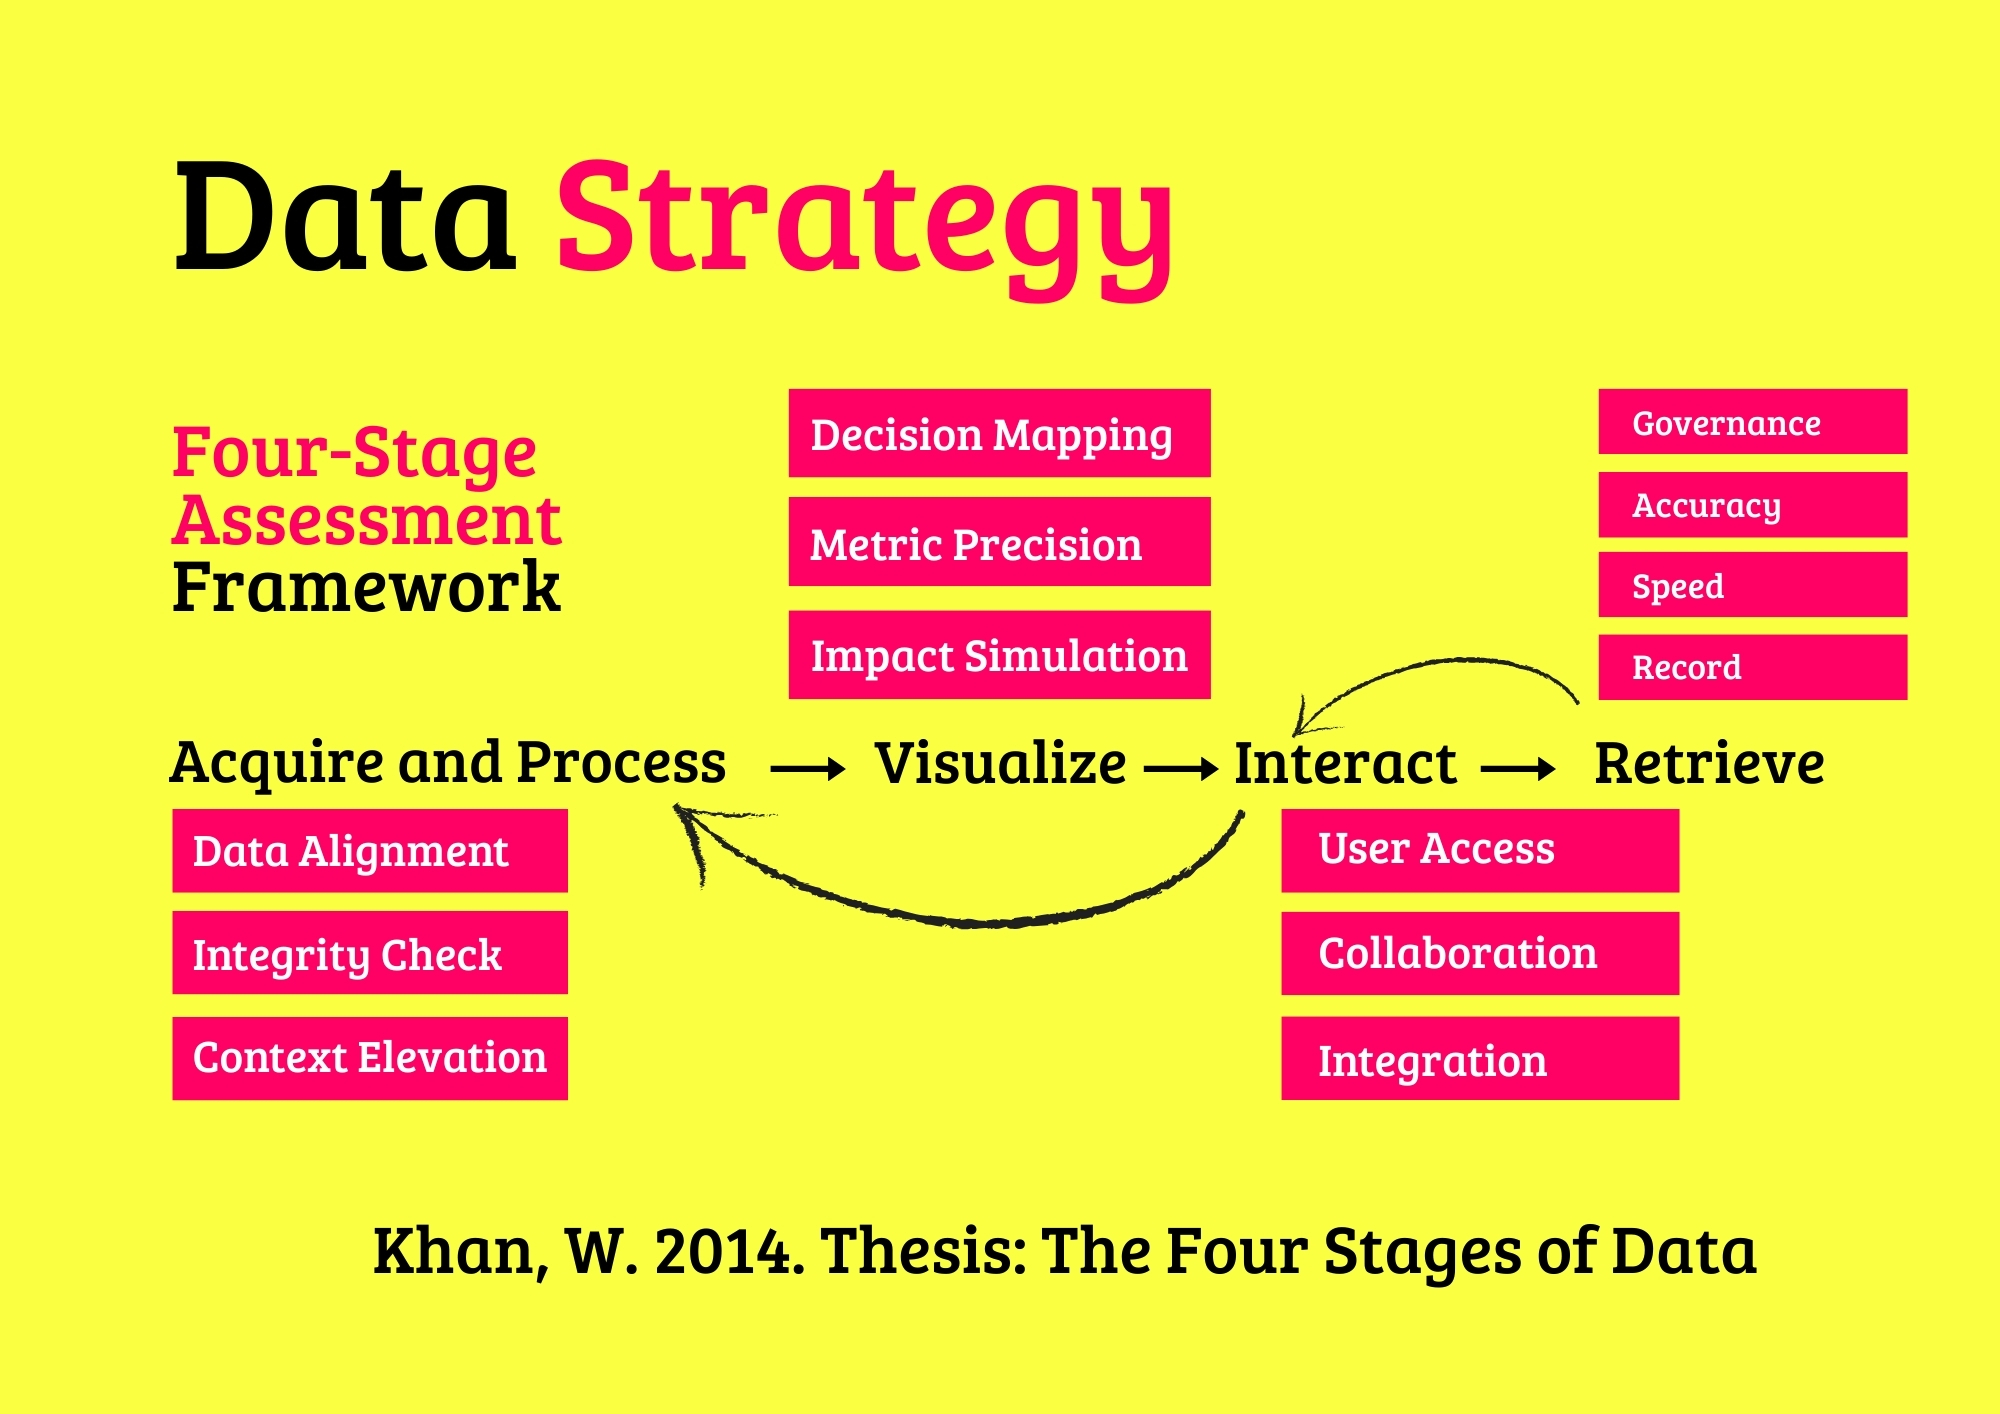
Data Strategy
Elevate your organization’s potential with our AI-enhanced data advisory services, delivering tailored strategies for sustainable success.
Frequently Asked Questions
What exactly is an AI Business Agent?
An AI Business Agent is a virtual employee that can talk, write and act like a human. It handles calls, chats, bookings and customer support 24/7 in your brand voice. Each agent is trained on your data, workflows and tone to deliver accurate, consistent, and human-quality interactions.
How are AI Business Agents trained for my business?
We train each agent using your documentation, product data, call transcripts and FAQs. The agent learns to recognise customer intent, follow your processes, and escalate to human staff when required. Continuous retraining keeps performance accurate and up to date.
What makes AI Business Agents better than chatbots?
Unlike traditional chatbots, AI Business Agents use advanced language models, voice technology and contextual memory. They understand full conversations, manage complex requests, and speak naturally — creating a human experience without waiting times or errors.
Can AI Business Agents integrate with our existing tools?
Yes. We connect agents to your telephony, CRM, booking system and internal databases. Platforms like Twilio, WhatsApp, HubSpot, Salesforce and Google Workspace work seamlessly, allowing agents to perform real actions such as scheduling, updating records or sending follow-up emails.
How do you monitor and maintain AI Business Agents?
Our team provides 24/7 monitoring, quality checks and live performance dashboards. We retrain agents with new data, improve tone and accuracy, and ensure uptime across all communication channels. You always have full visibility and control.
What industries can benefit from AI Business Agents?
AI Business Agents are already used in healthcare, beauty, retail, professional services, hospitality and education. They manage appointments, take orders, answer enquiries, and follow up with customers automatically — freeing staff for higher-value work.
How secure is our data when using AI Business Agents?
We apply strict data governance including encryption, access control and GDPR compliance. Each deployment runs in secure cloud environments with audit logs and permission-based data access to protect customer information.
Do you still offer data and analytics services?
Yes. Data remains the foundation of every AI Business Agent. We design strategies, pipelines and dashboards in Power BI, Tableau and Looker to measure performance and reveal new opportunities. Clean, structured data makes AI agents more intelligent and effective.
What ongoing support do you provide?
Every client receives continuous optimisation, analytics reviews and strategy sessions. We track performance, monitor response quality and introduce updates as your business evolves — ensuring your AI Business Agents stay aligned with your goals.
Can you help us combine AI with our existing team?
Absolutely. Our approach is hybrid: AI agents handle repetitive, time-sensitive tasks, while your human staff focus on relationship-building and creative work. Together they create a seamless, scalable customer experience.
AI Business Agents in Action


