Data That Delivers: Unlocking Impact for Solopreneurs and Businesses

A punchy guide to harnessing data focus for real results, boosting productivity and growth for solopreneurs and teams alike.
Data That Delivers: Unlocking Impact for Solopreneurs and Businesses

The Data Edge

Data’s everywhere—but it’s not about drowning in it; it’s about making it work. For solopreneurs juggling a one-person show or teams steering bigger ships, data focus is your shortcut to real results. It’s the difference between guessing and knowing, flailing and flying. At Caspia Data Consultancy, we’re here to show you how to cut through the noise and turn numbers into momentum—let’s dive in.


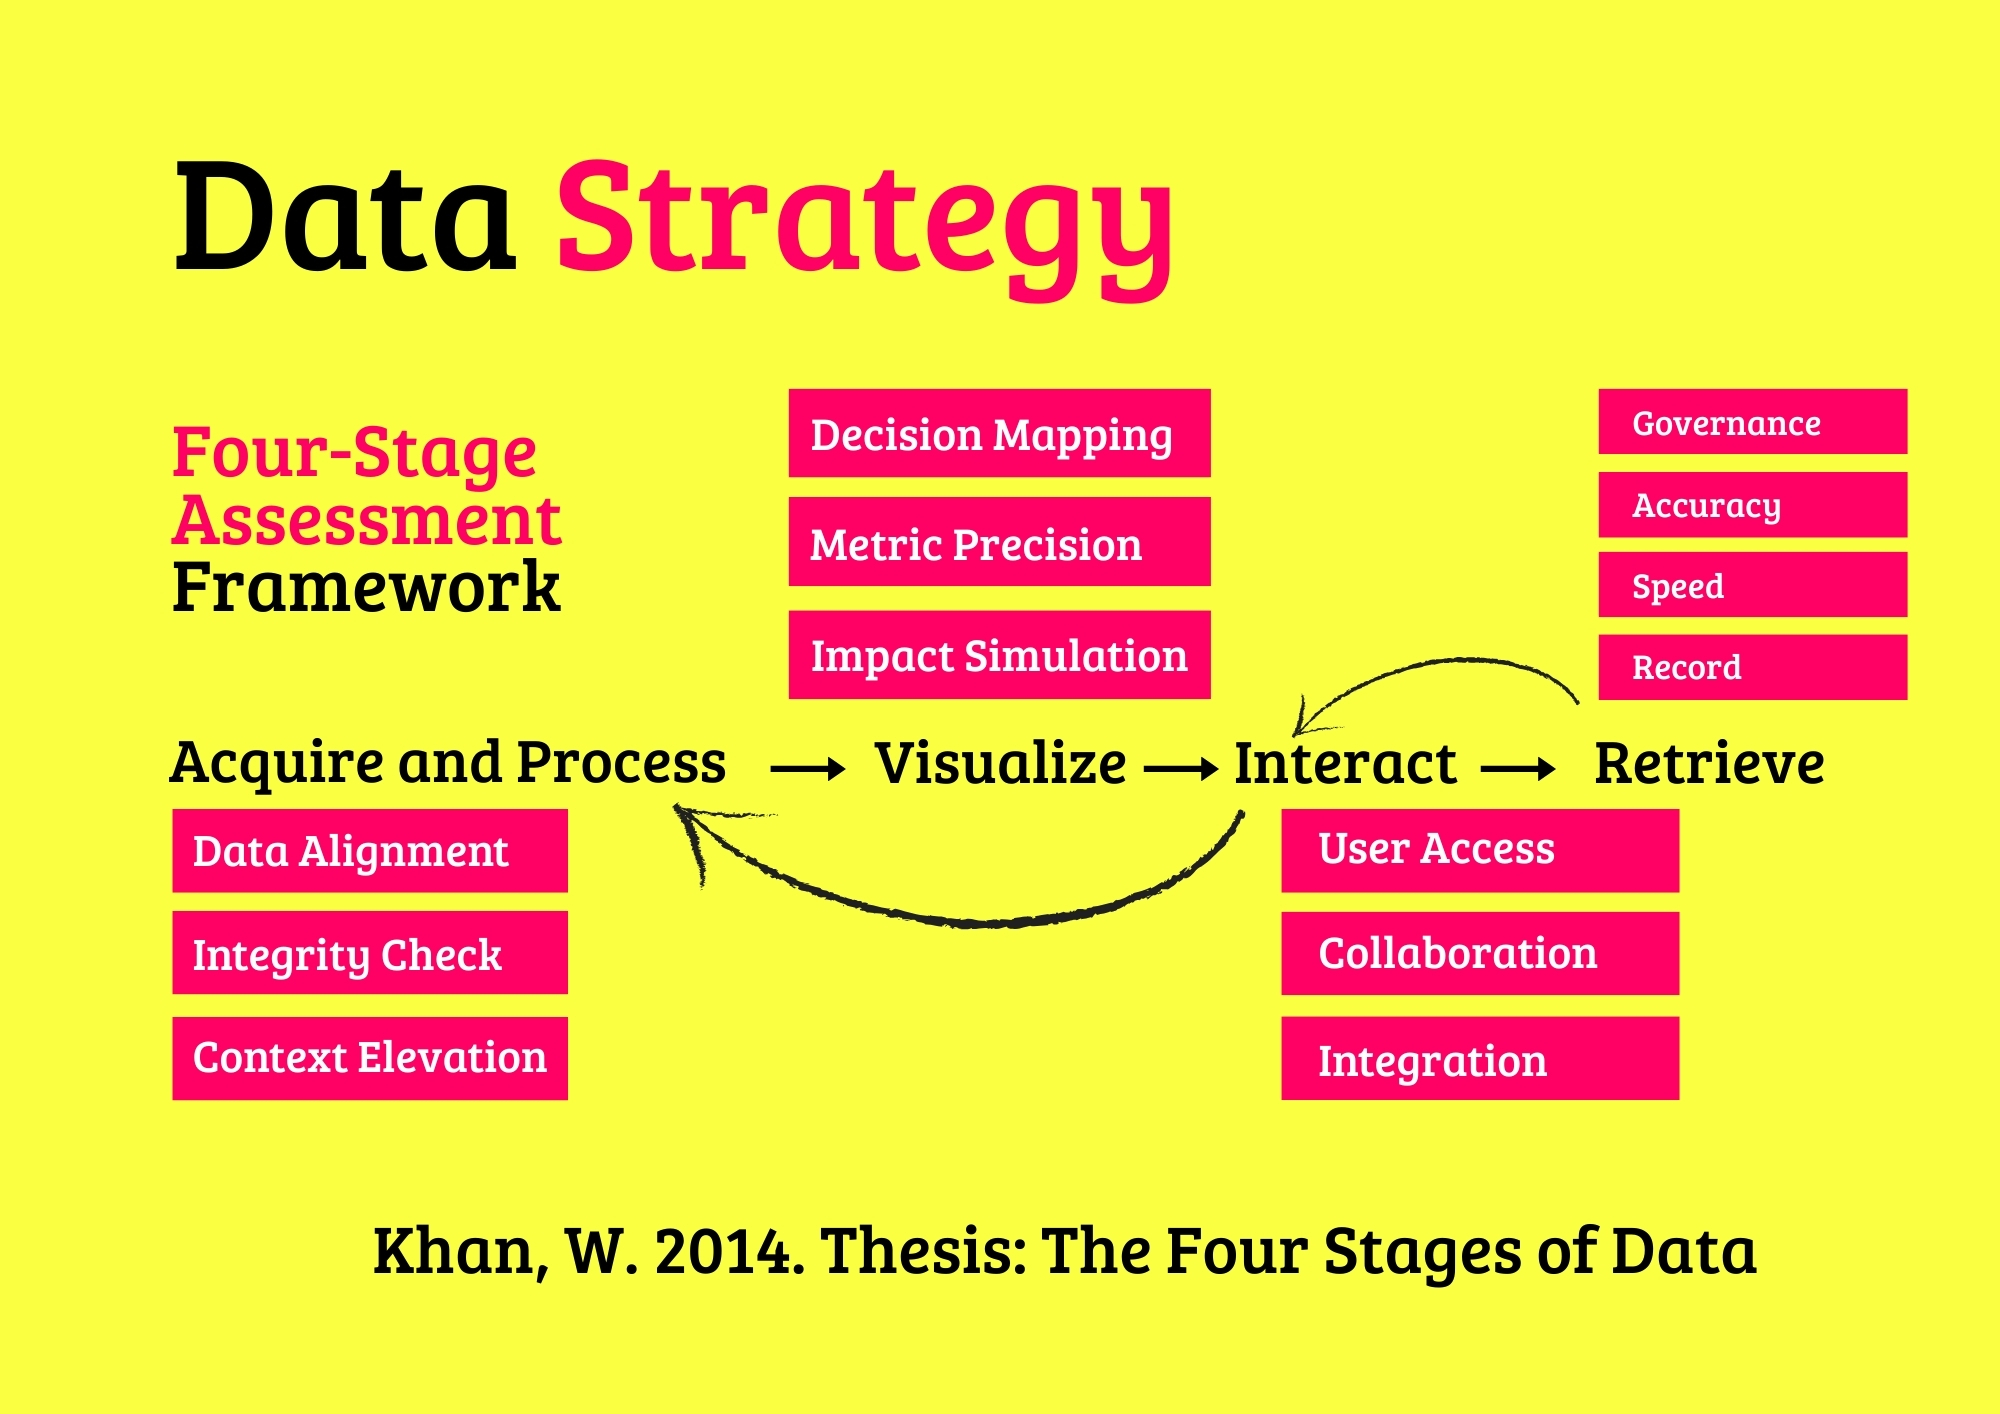
The Power of Precision

Pick Your Battles

Too much data’s a trap—chasing every stat leaves you stuck. Zero in on what moves the needle: sales spikes for a solo gig, engagement wins for a public project. Data focus clears the fog, spotlighting what actually counts.

Decide Like a Pro

Gut’s great, but insights are gold. Lean on vital metrics—think revenue trends or click-throughs—to map your next step. Ditch the hunches; data’s your crystal ball, revealing paths you’d miss otherwise.


Zooming In

Laser On, Distractions Off

Growth isn’t random—it’s targeted. Pinpoint your key zones—audience quirks or service gaps—and watch your efforts hit harder. A solopreneur might track follower vibes; a team might eye operational wins. Focus fuels confidence.
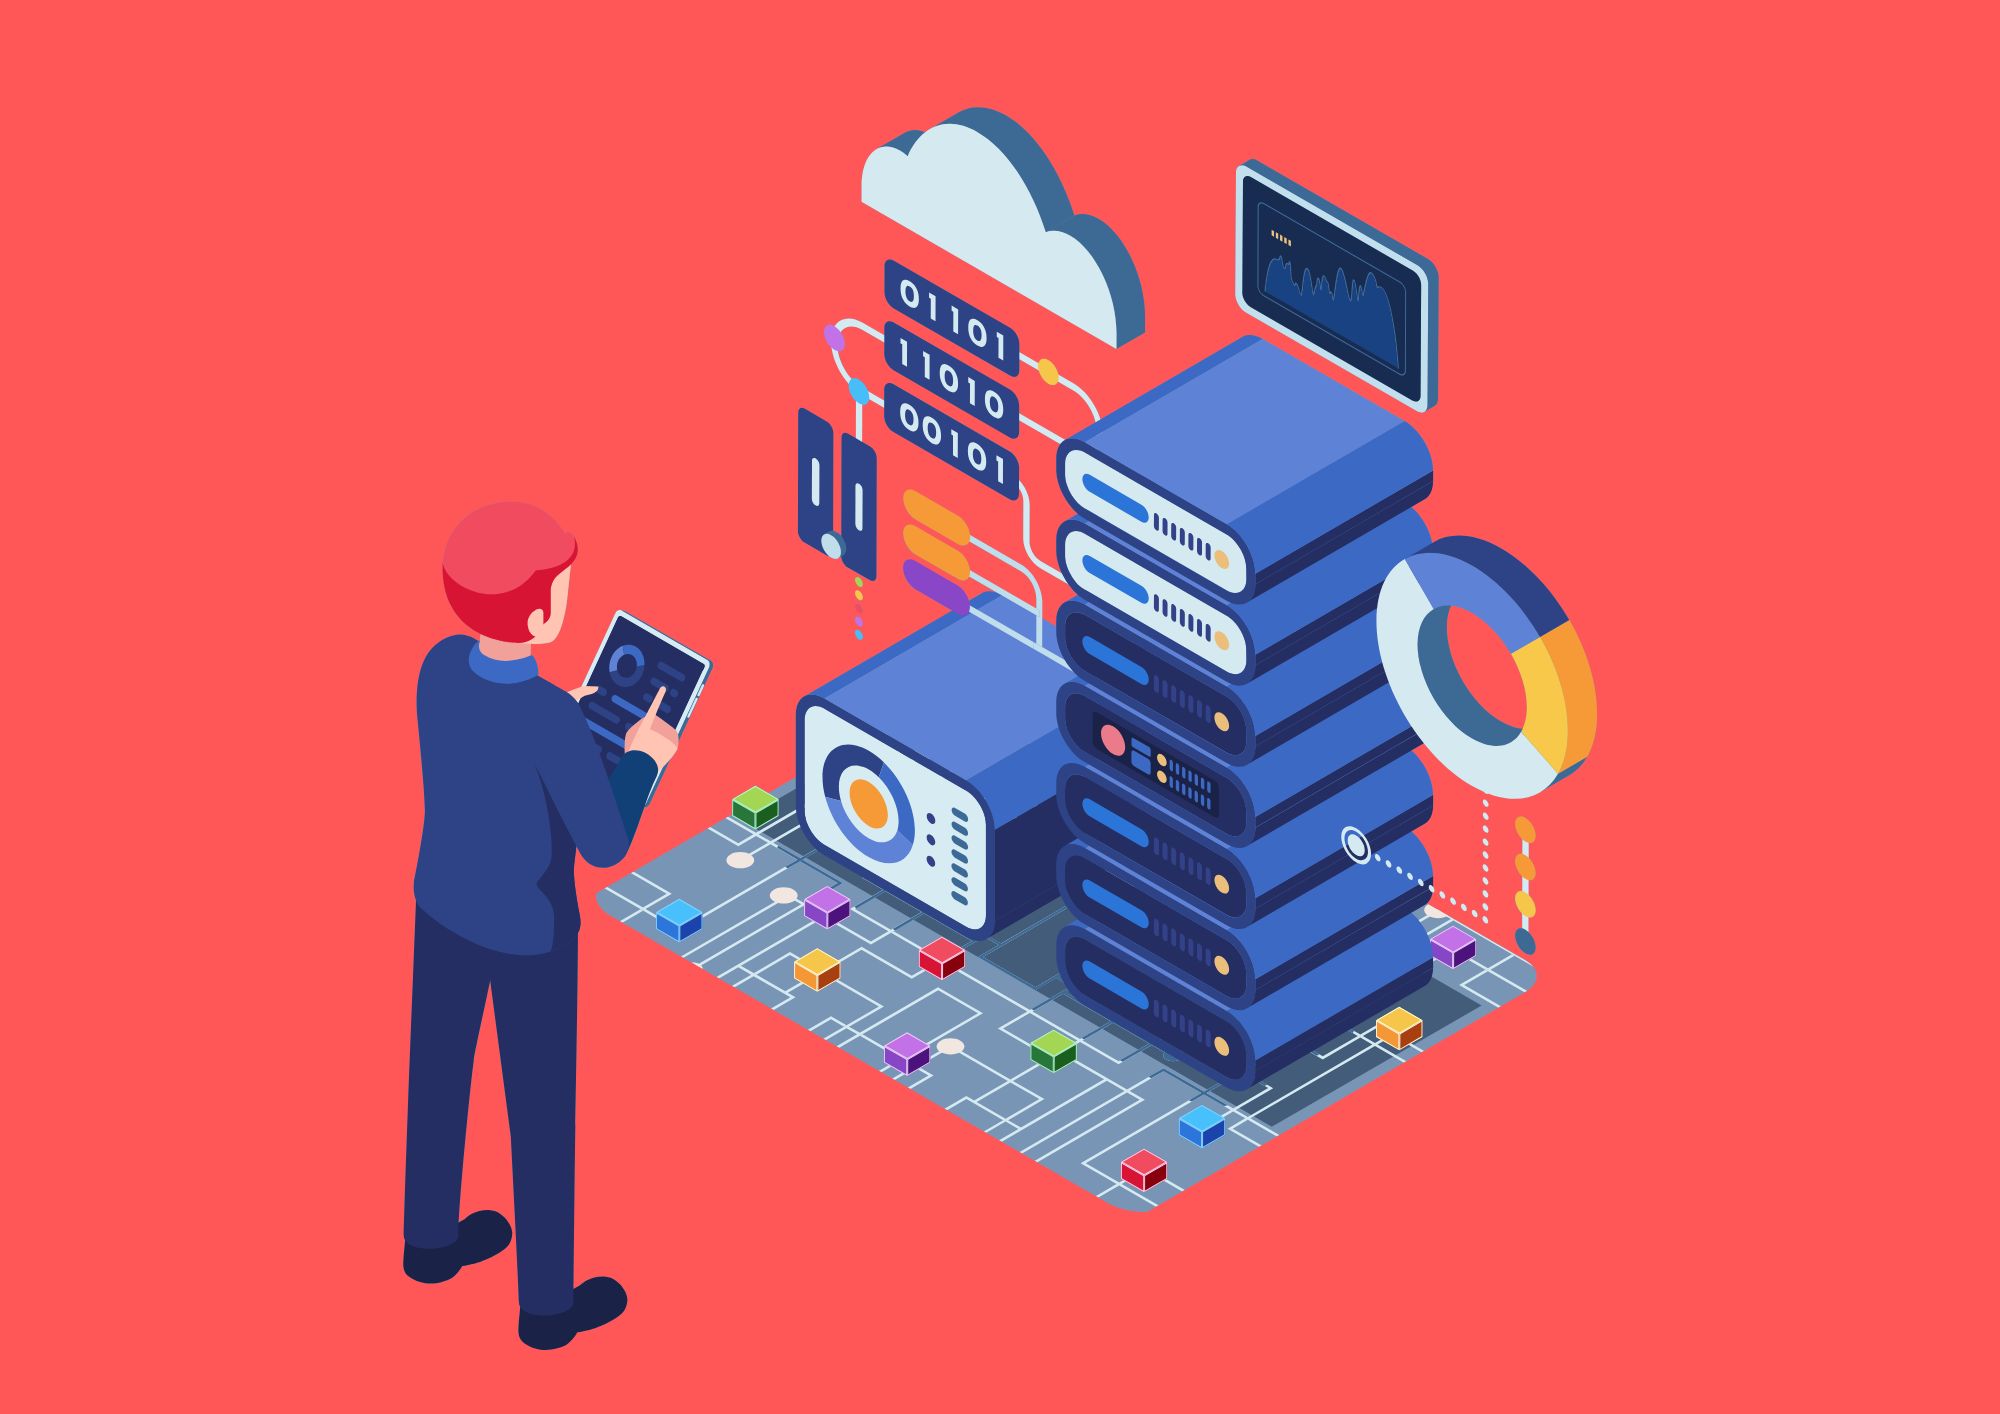

Gears That Grind

Systems That Sing

Good data needs a good ride. Tools like Mixpanel or Tableau pull the threads—visitor habits, performance beats—into one smooth tune 1. Automate the grunt work, and your vital metrics stay fresh without the fuss.
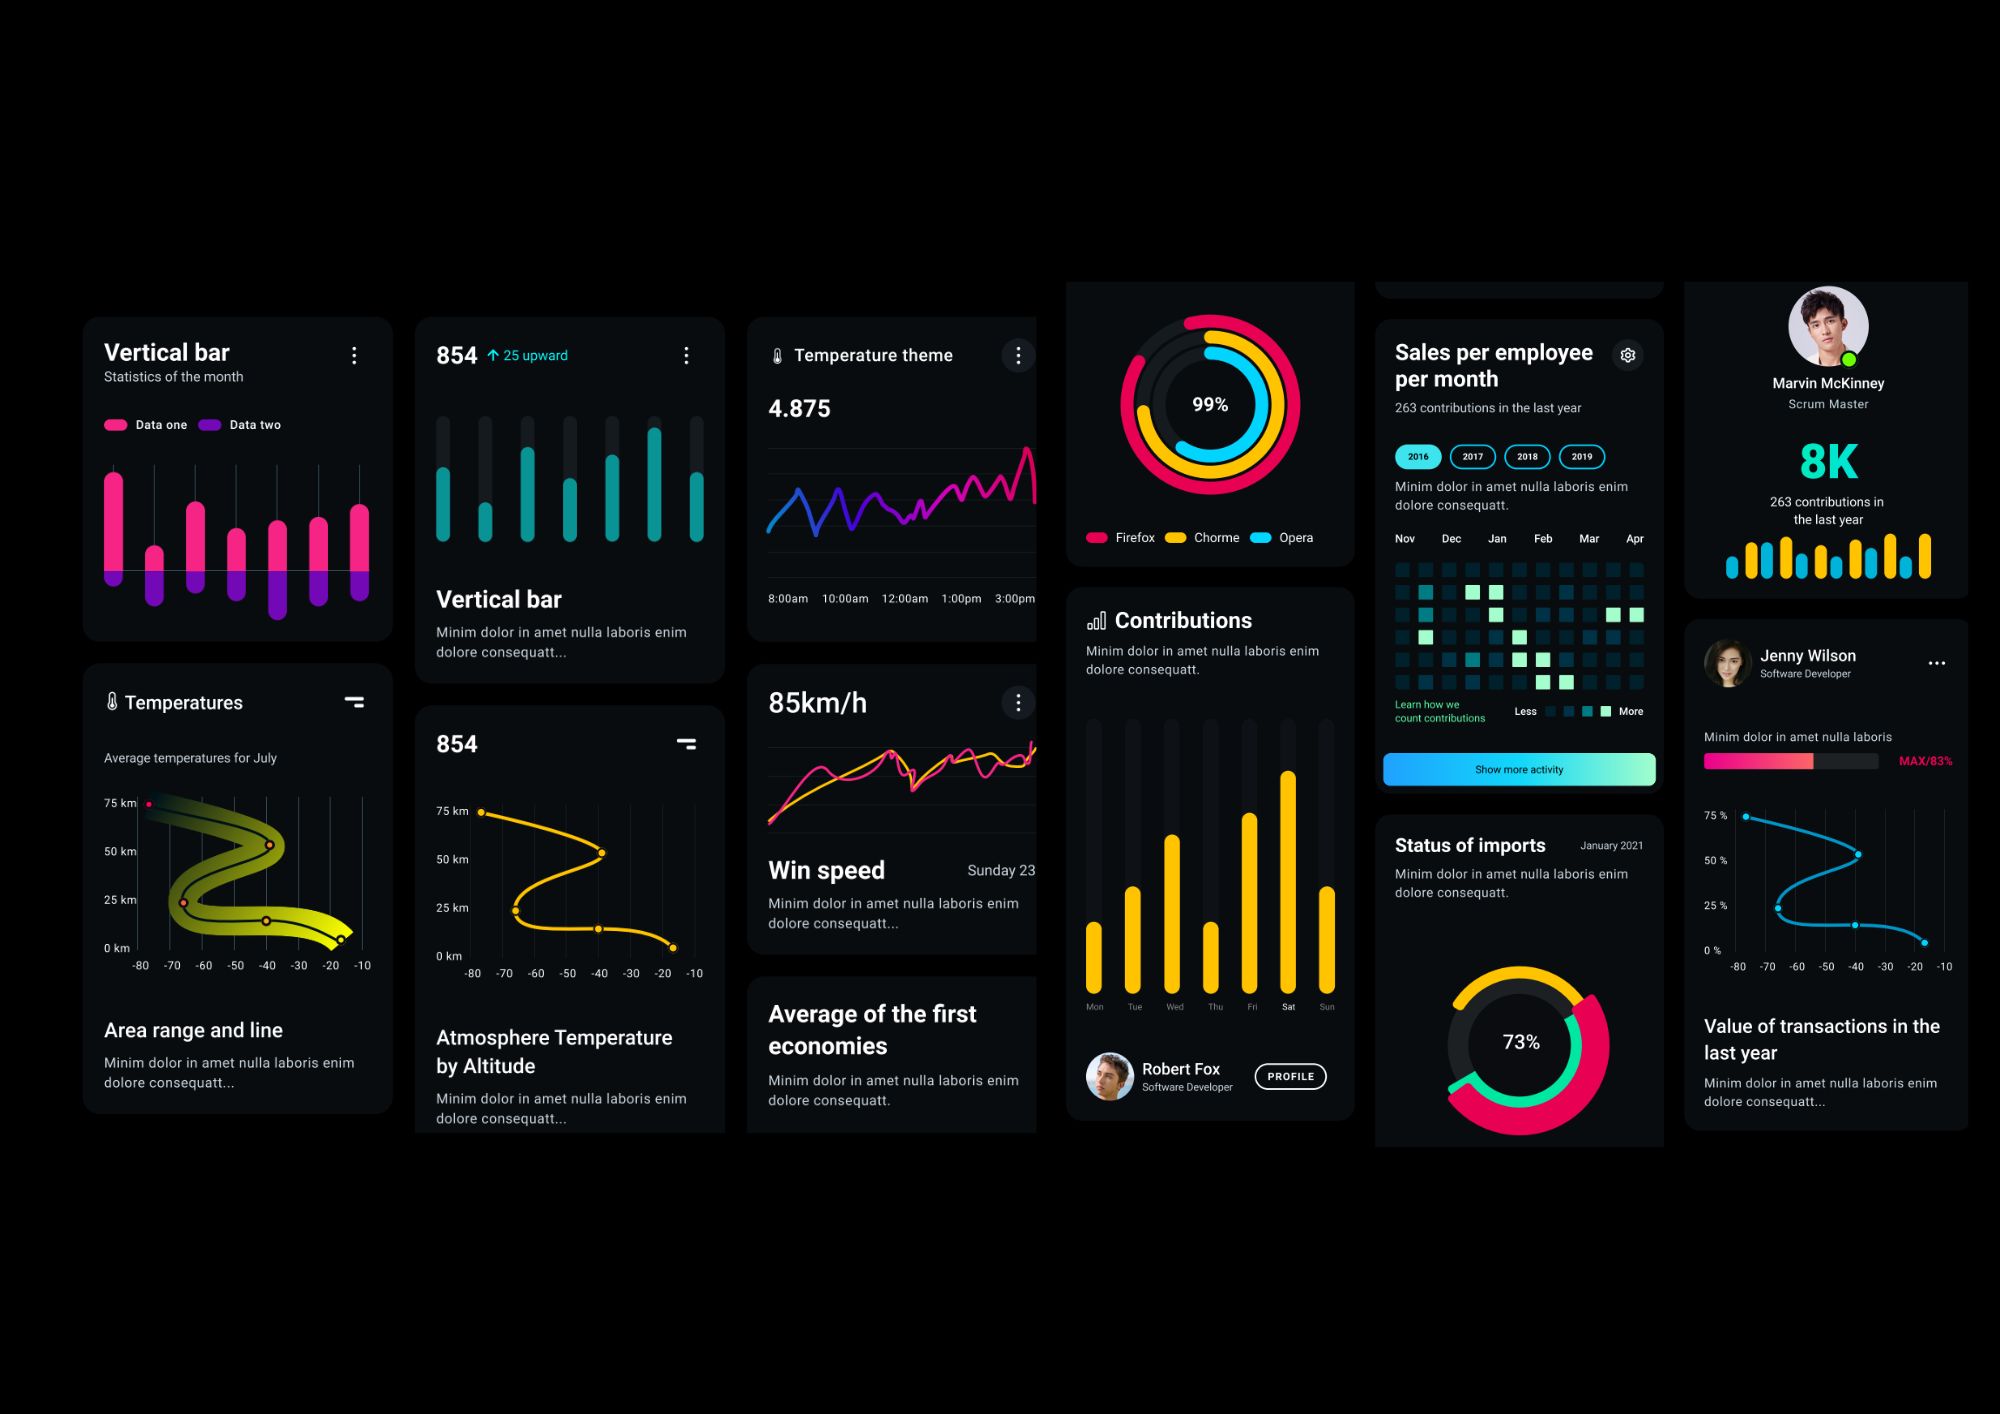
Spot the Story

Patterns don’t shout—they whisper. Dig into trends—where’s the uptick, where’s the dip?—and pair it with a “What’s your take?” from your crowd. That mash-up’s your ticket to smart moves.


The Payoff

Results That Stick

Data isn’t decoration—it’s direction. Sharp priorities turn raw info into steps that land. Businesses that adapt fast—tweaking based on what works—don’t just grow; they thrive long-term.


Words That Wire You

Books can flip the switch—here’s a trio to spark your data game:

  • “Measure What Matters” by John Doerr
    Nail the metrics that drive your mission forward 2.
  • “The Signals Are Talking” by Amy Webb
    Spot trends early and turn them into wins.
  • “Storytelling with Data” by Cole Nussbaumer Knaflic
    Make your numbers sing to anyone who’s listening.

Why It’s Your Shot

At Caspia Data Consultancy, we’ve seen the magic: a lone coach triples reach with the right stats, a public team slashes waste by reading the signs. Data focus isn’t a perk—it’s the pulse of real results. We bring the know-how to make it yours.


Conclusion

Data’s your co-pilot, not your clutter. With data focus, you’re not just crunching—you’re creating, turning insights into impact for solopreneurs and businesses alike. Caspia Data Consultancy hands you the wheel, steering you to productivity and growth that lasts. Plug in now—your breakthrough’s waiting.


References

  1. Tableau. (2025). See the Bigger Picture. Retrieved from https://www.tableau.com/

  2. Doerr, J. (2025). Measure What Matters: OKRs in Action. Retrieved from https://www.whatmatters.com/

Data That Delivers: Unlocking Impact for Solopreneurs and Businesses
Data Security

Data Security

Safeguard your data with our four-stage supervision and assessment framework, ensuring robust, compliant, and ethical security practices for resilient organizational trust and protection.

Data and Machine Learning

Data and Machine Learning

Harness the power of data and machine learning with our four-stage supervision and assessment framework, delivering precise, ethical, and scalable AI solutions for transformative organizational impact.

AI Data Workshops

AI Data Workshops

Empower your team with hands-on AI data skills through our four-stage workshop framework, ensuring practical, scalable, and ethical AI solutions for organizational success.

Data Engineering

Data Engineering

Architect and optimize robust data platforms with our four-stage supervision and assessment framework, ensuring scalable, secure, and efficient data ecosystems for organizational success.

Data Visualization

Data Visualization

Harness the power of visualization charts to transform complex datasets into actionable insights, enabling evidence-based decision-making across diverse organizational contexts.

Insights and Analytics

Insights and Analytics

Transform complex data into actionable insights with advanced analytics, fostering evidence-based strategies for sustainable organizational success.

Data Strategy

Data Strategy

Elevate your organization’s potential with our AI-enhanced data advisory services, delivering tailored strategies for sustainable success.

We're Here to Help!

How do you help us acquire data effectively?

We assess your existing data sources and streamline collection using tools like Excel, Python, and SQL. Our process ensures clean, structured, and reliable data through automated pipelines, API integrations, and validation techniques tailored to your needs.

What’s involved in visualizing our data?

We design intuitive dashboards in Tableau, Power BI, or Looker, transforming raw data into actionable insights. Our approach includes KPI alignment, interactive elements, and advanced visual techniques to highlight trends, outliers, and opportunities at a glance.

How can we interact with our data?

We build dynamic reports in Power BI or Tableau, enabling real-time exploration. Filter, drill down, or simulate scenarios—allowing stakeholders to engage with data directly and uncover answers independently.

How do you ensure we can retrieve data quickly?

We optimize storage and queries using Looker’s semantic models, Qlik’s indexing, or cloud solutions like Snowflake. Techniques such as caching and partitioning ensure milliseconds-fast access to critical insights.

How do you assess our data strategy?

We evaluate your goals, data maturity, and gaps using frameworks like Qlik or custom scorecards. From acquisition to governance, we map a roadmap that aligns with your business impact and ROI.

What does Data Engineering entail for acquisition?

We design scalable ETL/ELT pipelines to automate data ingestion from databases, APIs, and cloud platforms. This ensures seamless integration into your systems (e.g., Excel, data lakes) while maintaining accuracy and reducing manual effort.

How do Insights and Analytics use visualization?

Beyond charts, we layer statistical models and trends into Tableau or Power BI dashboards. This turns complex datasets into clear narratives, helping teams spot patterns, correlations, and actionable strategies.

Can Data Visualisation improve interaction?

Yes. Our interactive Power BI/Tableau reports let users filter, segment, and explore data in real time. This fosters data-driven decisions by putting exploration tools directly in stakeholders’ hands.

How do you secure data during retrieval?

We implement encryption (in transit/at rest), role-based access controls (RBAC), and audit logs via Looker or Microsoft Purview. Regular penetration testing ensures compliance with GDPR, CCPA, or industry standards.

How does Machine Learning enhance data interaction?

We integrate ML models into platforms like Qlik or Power BI, enabling users to interact with predictions (e.g., customer churn, sales forecasts) and simulate "what-if" scenarios for proactive planning.

What do AI and Data Workshops teach about acquisition?

Our workshops train teams in practical data acquisition using Excel, Python, and Tableau. Topics include validation, transformation, and automation—equipping your staff with skills to handle real-world data challenges.

How do you assess which tools fit our data stages?

We analyze your workflow across acquisition, storage, analysis, and visualization. Based on your needs, we recommend tools like Power BI (visuals), Looker (modeling), or Qlik (indexing) to optimize each stage.

Can you evaluate our data retrieval speed?

Yes. We audit query performance, database design, and network latency. Solutions may include Qlik’s in-memory processing, indexing, or migrating to columnar databases for near-instant insights.

How do ongoing assessments improve visualization?

We periodically review dashboards to refine UI/UX, optimize load times, and incorporate new data sources. This ensures visuals remain relevant, performant, and aligned with evolving business goals.

Central Limit Theorem

The Central Limit Theorem makes sample averages bell-shaped, powering reliable predictions.

Lena

Lena

Statistician

Neural Network Surge

Neural networks, with billions of connections, drive AI feats like real-time translation.

Eleane

Eleane

AI Researcher

Vector Spaces

Vector spaces fuel AI algorithms, enabling data transformations for machine learning.

Edmond

Edmond

Mathematician

Zettabyte Era

A zettabyte of data—10^21 bytes—flows yearly, shaping AI and analytics globally.

Sophia

Sophia

Data Scientist

NumPy Speed

NumPy crunches millions of numbers in milliseconds, a backbone of data science coding.

Kam

Kam

Programmer

Decision Trees

Decision trees split data to predict outcomes, simplifying choices in AI models.

Jasmine

Jasmine

Data Analyst

ChatGPT Impact

ChatGPT’s 2022 debut redefined AI, answering queries with human-like fluency.

Jamie

Jamie

AI Engineer

ANOVA Insights

ANOVA compares multiple groups at once, revealing patterns in data experiments.

Julia

Julia

Statistician

Snowflake Scale

Snowflake handles petabytes of cloud data, speeding up analytics for millions.

Felix

Felix

Data Engineer

BERT’s Language Leap

BERT understands context in text, revolutionizing AI search and chat since 2018.

Mia

Mia

AI Researcher

Probability Theory

Probability theory quantifies uncertainty, guiding AI decisions in chaotic systems.

Paul

Paul

Mathematician

K-Means Clustering

K-Means groups data into clusters, uncovering hidden trends in markets and more.

Emilia

Emilia

Data Scientist

TensorFlow Reach

TensorFlow builds AI models for millions, from startups to global tech giants.

Danny

Danny

Programmer

Power BI Visuals

Power BI turns raw data into visuals, cutting analysis time by 60% for teams.

Charlotte

Charlotte

Data Analyst

YOLO Detection

YOLO detects objects in real time, enabling AI vision in drones and cameras.

Squibb

Squibb

AI Engineer

Standard Deviation

Standard deviation measures data spread, a universal metric for variability.

Sam

Sam

Statistician

Calculus in AI

Calculus optimizes AI by finding minima, shaping models like neural networks.

Larry

Larry

Mathematician

Airflow Automation

Airflow orchestrates data workflows, running billions of tasks for analytics daily.

Tabs

Tabs

Data Engineer

Reinforcement Learning

Reinforcement learning trains AI through rewards, driving innovations like self-driving cars.

Mitchell

Mitchell

AI Researcher

Join over 2K+ data enthusiasts mastering insights with us.
Lena
Eleane
Edmond
Sophia
Kam
Jasmine
Jamie
Julia
Felix
Mia
Paul
Emilia
Danny
Charlotte
Squibb
Sam
Larry
Tabs
Mitchell
Data value transformation process

Data Stuck in Spreadsheets? Unlock Its $1M Potential in 90 Days

87% of companies underutilize their data assets (Forrester). Caspia's proven 3-phase AI advisory framework:

Diagnose hidden opportunities in your data
Activate AI-powered automation
Scale insights across your organization

Limited capacity - Book your assessment now.

Get Our ROI Calculator