How Podcasters Can Reclaim Their Brand Destiny

A fresh perspective on why podcasters and organisational creators lose grip on their brands—and how data insights and communication visualisations can chart a path to independence.
How Podcasters Can Reclaim Their Brand Destiny

The Illusion of Influence

Podcasters captivate millions with their voices, weaving stories and insights that echo across platforms like YouTube and Spotify. Yet beneath this apparent triumph lies a quiet erosion: the loss of brand ownership. By anchoring their success to third-party ecosystems, creators—whether solo voices or organisational storytellers—hand over their audience, content, and future to platforms that thrive on their creativity. At Caspia Data Consultancy, we believe there’s a better way: harnessing data insights and communication visualisations to reclaim control and build a lasting legacy.


The Platform Paradox

Picture this: a podcaster amasses a million subscribers, their episodes racking up views by the thousands. The platform celebrates, pocketing ad revenue and hoarding listener data, while the creator earns a sliver of the reward. It’s a gilded cage—visibility comes at the cost of autonomy. Public sector communicators risk losing reach for vital messages, while private brands see their marketing diluted by algorithmic whims. The narrative slips away, dictated by someone else’s rules.


Numbers Tell the Story

Success on platforms often feels monumental, but the reality of brand engagement paints a different picture. Below, we compare prominent podcasters’ platform reach with traffic to their own websites—a stark reminder of untapped potential:

Podcast Platform Reach (Subscribers) Owned Site Traffic /m Core Themes
Joe Rogan 19M (YouTube) 150K Culture, science, bold interviews
The Diary of a CEO 9.27M (YouTube) 100K Leadership, human stories
Lex Fridman 4.5M (YouTube) 250K Tech, philosophy, deep dives
Impaulsive 4.2M (YouTube) 10K Lifestyle, raw conversations
The Iced Coffee Hour 3.2M (YouTube) 15K Finance, practical advice

The gap is glaring. Millions tune in, yet only a fraction visit the creators’ own domains. Data insights reveal this disconnect, offering a roadmap to bridge it 1.


The Chains of Dependency

A Fragile Foundation

Platforms wield power through algorithms and policies that can shift without warning. One day you’re trending; the next, you’re buried. For organisations, this volatility jeopardises outreach—imagine a council’s podcast on public health fading into obscurity overnight. Creators become pawns, their brand consistency at the mercy of unseen gatekeepers.

The Data Divide

Audience insights—who’s listening, what they value—stay locked in platform vaults. Without this knowledge, podcasters can’t refine their craft or build direct relationships. It’s a missed chance to turn listeners into loyal advocates.


What’s Left Behind

Every episode uploaded solely to a platform is a missed opportunity. Followers don’t translate into subscribers on your terms. Valuable data—email addresses, preferences, engagement patterns—slips through your fingers. For private firms, this means lost leads; for public bodies, it’s a weaker pulse on community needs. The platform wins, while your brand’s potential gathers dust.


Crafting Your Own Stage

A Home of Your Own

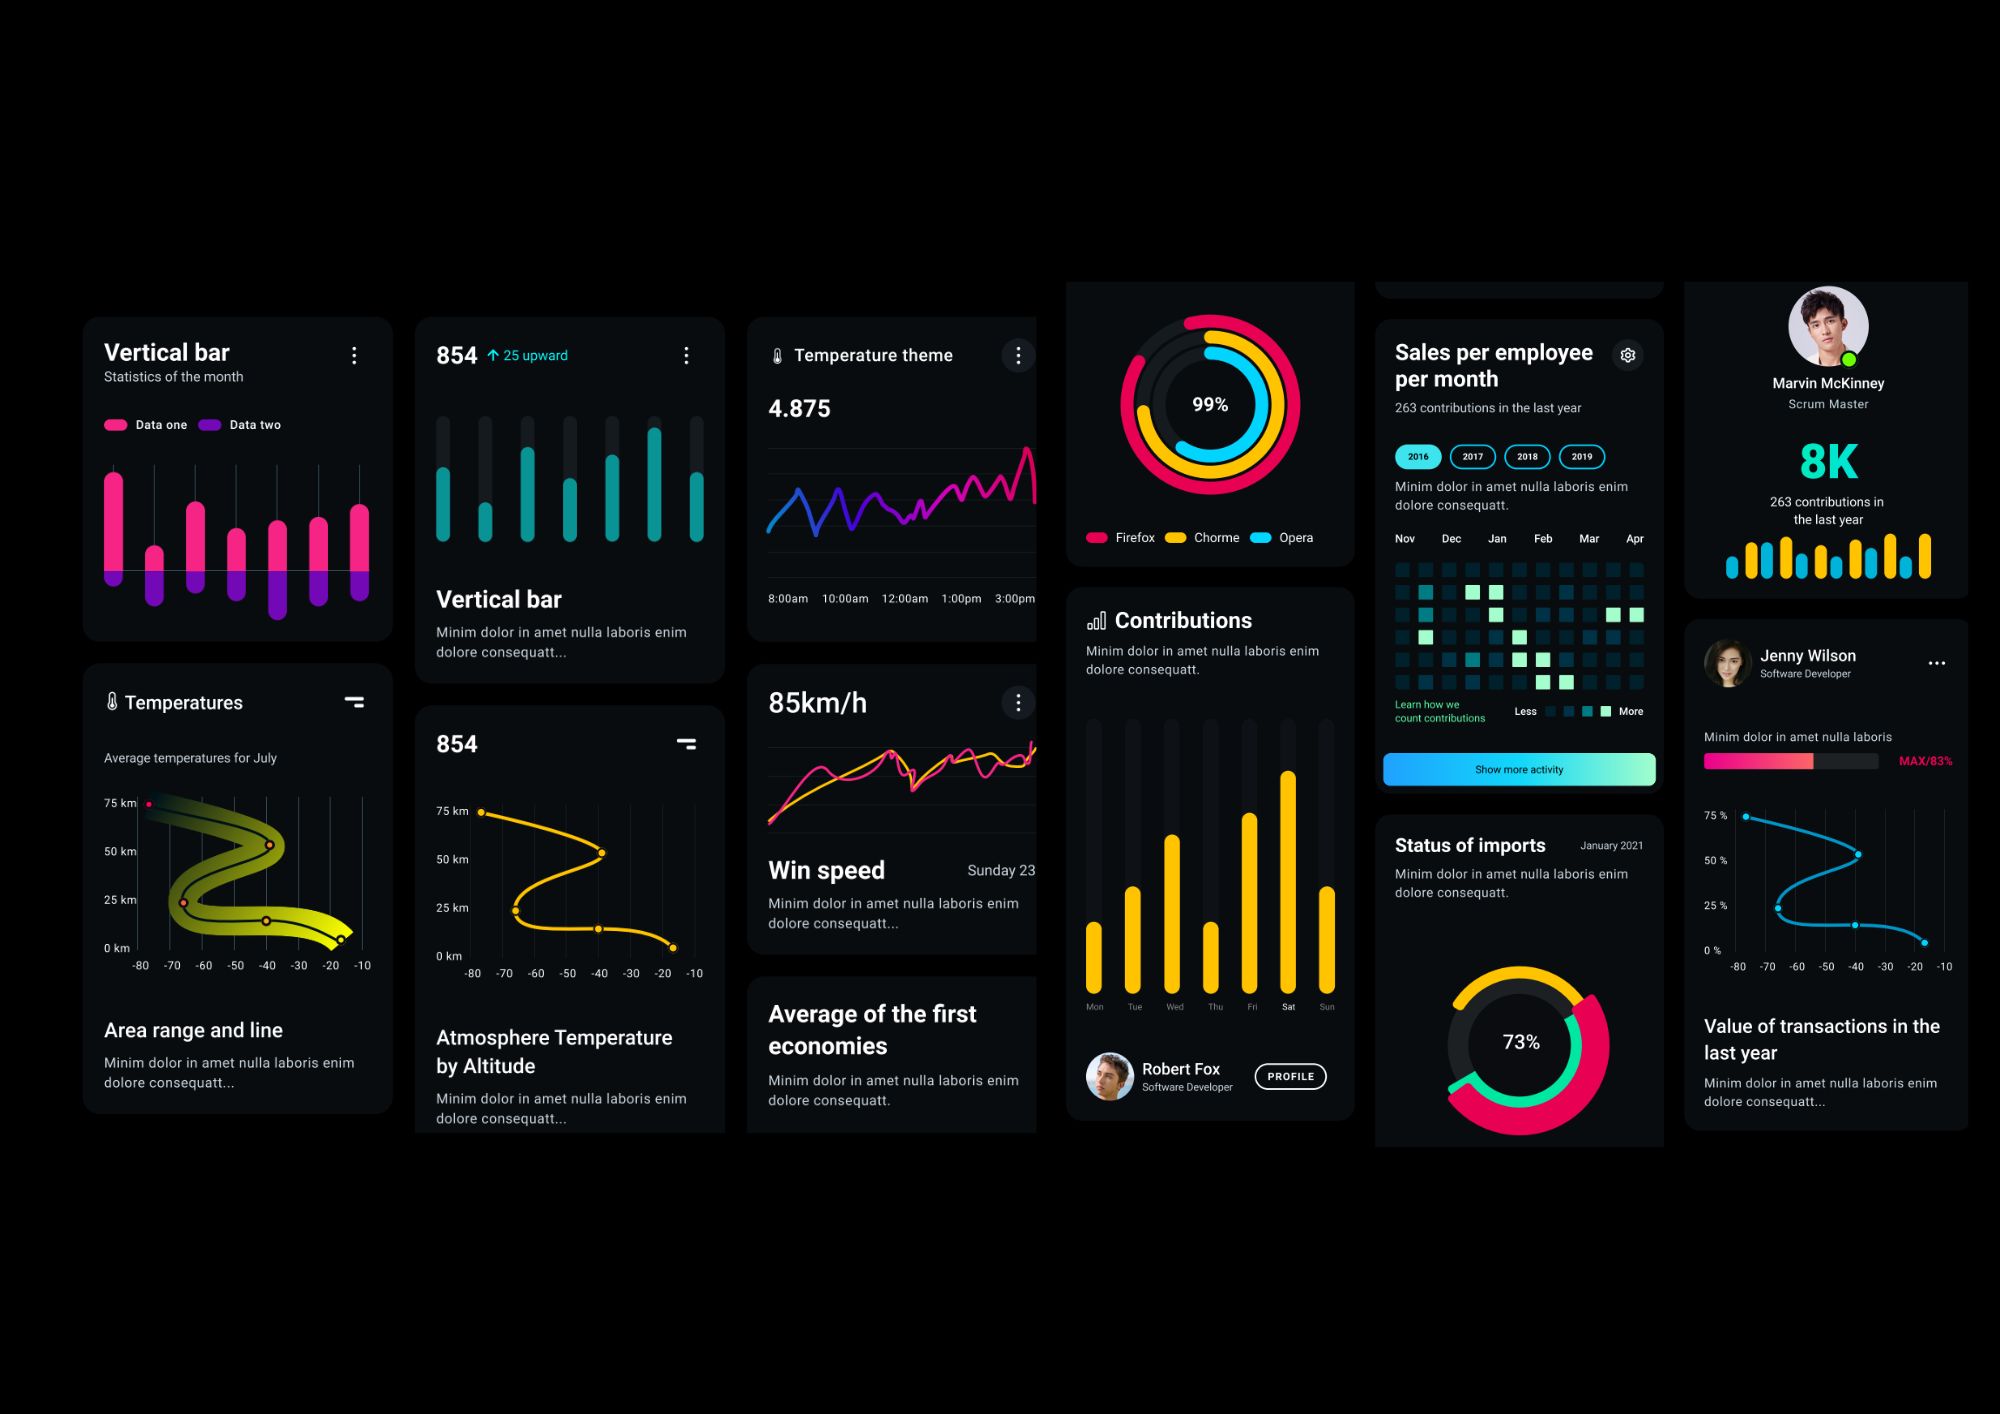
Imagine a digital hub where your podcast lives alongside blogs, events, and exclusive content—all under your banner. This isn’t just a website; it’s your ecosystem, free from algorithmic shackles. Here, you shape the story, own the data, and decide the monetisation. Communication visualisations—like listener trend charts or engagement maps—bring clarity, turning raw numbers into compelling narratives for stakeholders 2.

Platforms as Pathways

Use YouTube or Spotify as springboards, not destinations. Tease your audience with snippets, then guide them to your domain for the full experience. It’s a subtle shift with profound impact—transforming transient viewers into a dedicated community.


A Blueprint for Mastery

Claim Your Voice

Offer exclusive content—think in-depth analyses or behind-the-scenes insights—that platforms can’t replicate. A council might share policy breakdowns, a business might unveil industry forecasts. This builds brand authority and pulls listeners to your turf.

Own Your Audience

Capture data with intent. Tools like encrypted email forms or analytics platforms let you understand your listeners while respecting privacy laws like GDPR 3. It’s not just about numbers—it’s about knowing who’s with you.

Build for Tomorrow

Create timeless resources—guides, archives, or case studies—that keep people coming back. Evergreen content strengthens brand recall, ensuring your influence endures beyond the latest episode.


A Tale of Triumph

A mid-sized firm’s podcast struggled with platform reliance until Caspia Data Consultancy stepped in. We built a branded hub, using data insights to track a 50% jump in direct traffic within months. Visual dashboards highlighted listener retention, refining their approach and unlocking new revenue through subscriptions—all while staying compliant and secure.


Why Caspia Data Consultancy?

At Caspia Data Consultancy, we turn data into power. We help podcasters and organisations weave data insights and communication visualisations into strategies that reclaim brand ownership. Whether you’re a public entity engaging citizens or a private creator growing a legacy, we’re your partner in breaking free.


Conclusion

Podcasters don’t have to be tenants in someone else’s empire. By stepping beyond platform dependency, you can craft a destiny that’s truly yours. With data insights lighting the way and communication visualisations telling your story, Caspia Data Consultancy ensures your brand stands tall—resilient, independent, and unforgettable. The choice is clear: remain a guest, or build your own house.


References

  1. Sprout Social. (2025). Beyond the Platform: Measuring True Engagement. Retrieved from https://sproutsocial.com/

  2. Tableau. (2025). Crafting Stories with Data Visuals. Retrieved from https://www.tableau.com/

  3. Google. (2025). Analytics 360: Privacy-First Insights. Retrieved from https://analytics.google.com/

How Podcasters Can Reclaim Their Brand Destiny
Data Security

Data Security

Safeguard your data with our four-stage supervision and assessment framework, ensuring robust, compliant, and ethical security practices for resilient organizational trust and protection.

Data and Machine Learning

Data and Machine Learning

Harness the power of data and machine learning with our four-stage supervision and assessment framework, delivering precise, ethical, and scalable AI solutions for transformative organizational impact.

AI Data Workshops

AI Data Workshops

Empower your team with hands-on AI data skills through our four-stage workshop framework, ensuring practical, scalable, and ethical AI solutions for organizational success.

Data Engineering

Data Engineering

Architect and optimize robust data platforms with our four-stage supervision and assessment framework, ensuring scalable, secure, and efficient data ecosystems for organizational success.

Data Visualization

Data Visualization

Harness the power of visualization charts to transform complex datasets into actionable insights, enabling evidence-based decision-making across diverse organizational contexts.

Insights and Analytics

Insights and Analytics

Transform complex data into actionable insights with advanced analytics, fostering evidence-based strategies for sustainable organizational success.

Data Strategy

Data Strategy

Elevate your organization’s potential with our AI-enhanced data advisory services, delivering tailored strategies for sustainable success.

We're Here to Help!

How do you help us acquire data effectively?

We assess your existing data sources and streamline collection using tools like Excel, Python, and SQL. Our process ensures clean, structured, and reliable data through automated pipelines, API integrations, and validation techniques tailored to your needs.

What’s involved in visualizing our data?

We design intuitive dashboards in Tableau, Power BI, or Looker, transforming raw data into actionable insights. Our approach includes KPI alignment, interactive elements, and advanced visual techniques to highlight trends, outliers, and opportunities at a glance.

How can we interact with our data?

We build dynamic reports in Power BI or Tableau, enabling real-time exploration. Filter, drill down, or simulate scenarios—allowing stakeholders to engage with data directly and uncover answers independently.

How do you ensure we can retrieve data quickly?

We optimize storage and queries using Looker’s semantic models, Qlik’s indexing, or cloud solutions like Snowflake. Techniques such as caching and partitioning ensure milliseconds-fast access to critical insights.

How do you assess our data strategy?

We evaluate your goals, data maturity, and gaps using frameworks like Qlik or custom scorecards. From acquisition to governance, we map a roadmap that aligns with your business impact and ROI.

What does Data Engineering entail for acquisition?

We design scalable ETL/ELT pipelines to automate data ingestion from databases, APIs, and cloud platforms. This ensures seamless integration into your systems (e.g., Excel, data lakes) while maintaining accuracy and reducing manual effort.

How do Insights and Analytics use visualization?

Beyond charts, we layer statistical models and trends into Tableau or Power BI dashboards. This turns complex datasets into clear narratives, helping teams spot patterns, correlations, and actionable strategies.

Can Data Visualisation improve interaction?

Yes. Our interactive Power BI/Tableau reports let users filter, segment, and explore data in real time. This fosters data-driven decisions by putting exploration tools directly in stakeholders’ hands.

How do you secure data during retrieval?

We implement encryption (in transit/at rest), role-based access controls (RBAC), and audit logs via Looker or Microsoft Purview. Regular penetration testing ensures compliance with GDPR, CCPA, or industry standards.

How does Machine Learning enhance data interaction?

We integrate ML models into platforms like Qlik or Power BI, enabling users to interact with predictions (e.g., customer churn, sales forecasts) and simulate "what-if" scenarios for proactive planning.

What do AI and Data Workshops teach about acquisition?

Our workshops train teams in practical data acquisition using Excel, Python, and Tableau. Topics include validation, transformation, and automation—equipping your staff with skills to handle real-world data challenges.

How do you assess which tools fit our data stages?

We analyze your workflow across acquisition, storage, analysis, and visualization. Based on your needs, we recommend tools like Power BI (visuals), Looker (modeling), or Qlik (indexing) to optimize each stage.

Can you evaluate our data retrieval speed?

Yes. We audit query performance, database design, and network latency. Solutions may include Qlik’s in-memory processing, indexing, or migrating to columnar databases for near-instant insights.

How do ongoing assessments improve visualization?

We periodically review dashboards to refine UI/UX, optimize load times, and incorporate new data sources. This ensures visuals remain relevant, performant, and aligned with evolving business goals.

Central Limit Theorem

The Central Limit Theorem makes sample averages bell-shaped, powering reliable predictions.

Lena

Lena

Statistician

Neural Network Surge

Neural networks, with billions of connections, drive AI feats like real-time translation.

Eleane

Eleane

AI Researcher

Vector Spaces

Vector spaces fuel AI algorithms, enabling data transformations for machine learning.

Edmond

Edmond

Mathematician

Zettabyte Era

A zettabyte of data—10^21 bytes—flows yearly, shaping AI and analytics globally.

Sophia

Sophia

Data Scientist

NumPy Speed

NumPy crunches millions of numbers in milliseconds, a backbone of data science coding.

Kam

Kam

Programmer

Decision Trees

Decision trees split data to predict outcomes, simplifying choices in AI models.

Jasmine

Jasmine

Data Analyst

ChatGPT Impact

ChatGPT’s 2022 debut redefined AI, answering queries with human-like fluency.

Jamie

Jamie

AI Engineer

ANOVA Insights

ANOVA compares multiple groups at once, revealing patterns in data experiments.

Julia

Julia

Statistician

Snowflake Scale

Snowflake handles petabytes of cloud data, speeding up analytics for millions.

Felix

Felix

Data Engineer

BERT’s Language Leap

BERT understands context in text, revolutionizing AI search and chat since 2018.

Mia

Mia

AI Researcher

Probability Theory

Probability theory quantifies uncertainty, guiding AI decisions in chaotic systems.

Paul

Paul

Mathematician

K-Means Clustering

K-Means groups data into clusters, uncovering hidden trends in markets and more.

Emilia

Emilia

Data Scientist

TensorFlow Reach

TensorFlow builds AI models for millions, from startups to global tech giants.

Danny

Danny

Programmer

Power BI Visuals

Power BI turns raw data into visuals, cutting analysis time by 60% for teams.

Charlotte

Charlotte

Data Analyst

YOLO Detection

YOLO detects objects in real time, enabling AI vision in drones and cameras.

Squibb

Squibb

AI Engineer

Standard Deviation

Standard deviation measures data spread, a universal metric for variability.

Sam

Sam

Statistician

Calculus in AI

Calculus optimizes AI by finding minima, shaping models like neural networks.

Larry

Larry

Mathematician

Airflow Automation

Airflow orchestrates data workflows, running billions of tasks for analytics daily.

Tabs

Tabs

Data Engineer

Reinforcement Learning

Reinforcement learning trains AI through rewards, driving innovations like self-driving cars.

Mitchell

Mitchell

AI Researcher

Join over 2K+ data enthusiasts mastering insights with us.
Lena
Eleane
Edmond
Sophia
Kam
Jasmine
Jamie
Julia
Felix
Mia
Paul
Emilia
Danny
Charlotte
Squibb
Sam
Larry
Tabs
Mitchell
Data value transformation process

Data Stuck in Spreadsheets? Unlock Its $1M Potential in 90 Days

87% of companies underutilize their data assets (Forrester). Caspia's proven 3-phase AI advisory framework:

Diagnose hidden opportunities in your data
Activate AI-powered automation
Scale insights across your organization

Limited capacity - Book your assessment now.

Get Our ROI Calculator