
The Data Dilemma in Information & Communication
ICT businesses operate at the speed of light—yet many are slowed down by fragmented data and missed insights. Here’s what’s holding them back:
1. Disconnected Data Systems
CRM, CMS, ad platforms, and customer support tools operate in silos.
2. Delayed Customer Insights
Valuable signals from customer interactions take days or weeks to surface.
3. Inefficient Support Operations
Lack of real-time ticket analytics increases resolution time and churn.
4. Security Blind Spots
Log data and access trails often go unanalyzed until breaches occur.
5. Content Intelligence Gaps
Content engagement metrics scattered across tools with no central visibility.
6. Complex User Journeys
Cross-device, multi-channel interactions are hard to track and attribute.
7. Poor Campaign Attribution
Sales and marketing struggle to prove ROI without unified data.
8. Developer Productivity Bottlenecks
Engineering analytics for code health, deployment, and bugs are rarely integrated.
9. Compliance & Data Governance Risks
Growing regulations (GDPR, DPA) require proactive and automated data management.
10. Manual Reporting Overload
Analysts spend more time exporting CSVs than generating insights.
11. Missed Innovation Opportunities
Without data-driven feedback loops, teams miss the signals to pivot or improve.
How Caspia Fixes This:
We turn ICT complexity into clarity—via unified data platforms, automation-ready pipelines, and AI-powered analytics, built for agility and scale.
Caspia’s InfoComm Intelligence Framework
1. Unified Data Layer
Goal: Centralise all operational and customer data for analysis.
- Ingest from CRM, CDP, ad platforms, dev tools, and service desks.
- Build a single source of truth for users, tickets, content, and campaigns.
Tools: Snowflake, Fivetran, dbt
2. Customer Journey Analytics
Goal: Visualise full customer journeys and touchpoints.
- Stitch sessions, logins, purchases, and support tickets across devices.
- Segment by behaviour, intent, and churn risk.
Tools: Mixpanel, Google BigQuery, Looker
3. Operational Dashboards
Goal: Give teams real-time visibility across functions.
- DevOps metrics (build times, bug rates, deployments).
- Support KPIs (ticket velocity, CSAT, resolution bottlenecks).
- Marketing ROAS and channel breakdowns.
Tools: Power BI, Grafana, Metabase
4. AI-Powered Automation
Goal: Predict issues and trigger workflows automatically.
- Churn risk scoring and proactive outreach triggers.
- Security anomaly detection and auto-responses.
- Smart content tagging and recommendation engines.
Tools: Azure ML, Hugging Face, Zapier, LangChain
Why Digital Leaders Trust Caspia
✅ Engineered for Digital Workflows
From SaaS firms to media networks, we speak your tech stack.
✅ Speed to Insight
Clients cut data prep by 70% and surface key decisions in real time.
✅ Flexible & Scalable
Built to handle high-velocity data with security-first architecture.
“Caspia helped us unify customer data from 11 platforms and unlocked the insights we needed to reduce churn by 23% in one quarter.”
—Chief Data Officer, B2B SaaS Company
We're Here to Help!
Inbox Data Insights (IDI)
Turn email chaos into intelligence. Analyze, visualize, and secure massive volumes of inbox data with Inbox Data Insights (IDI) by Caspia.

Data Security
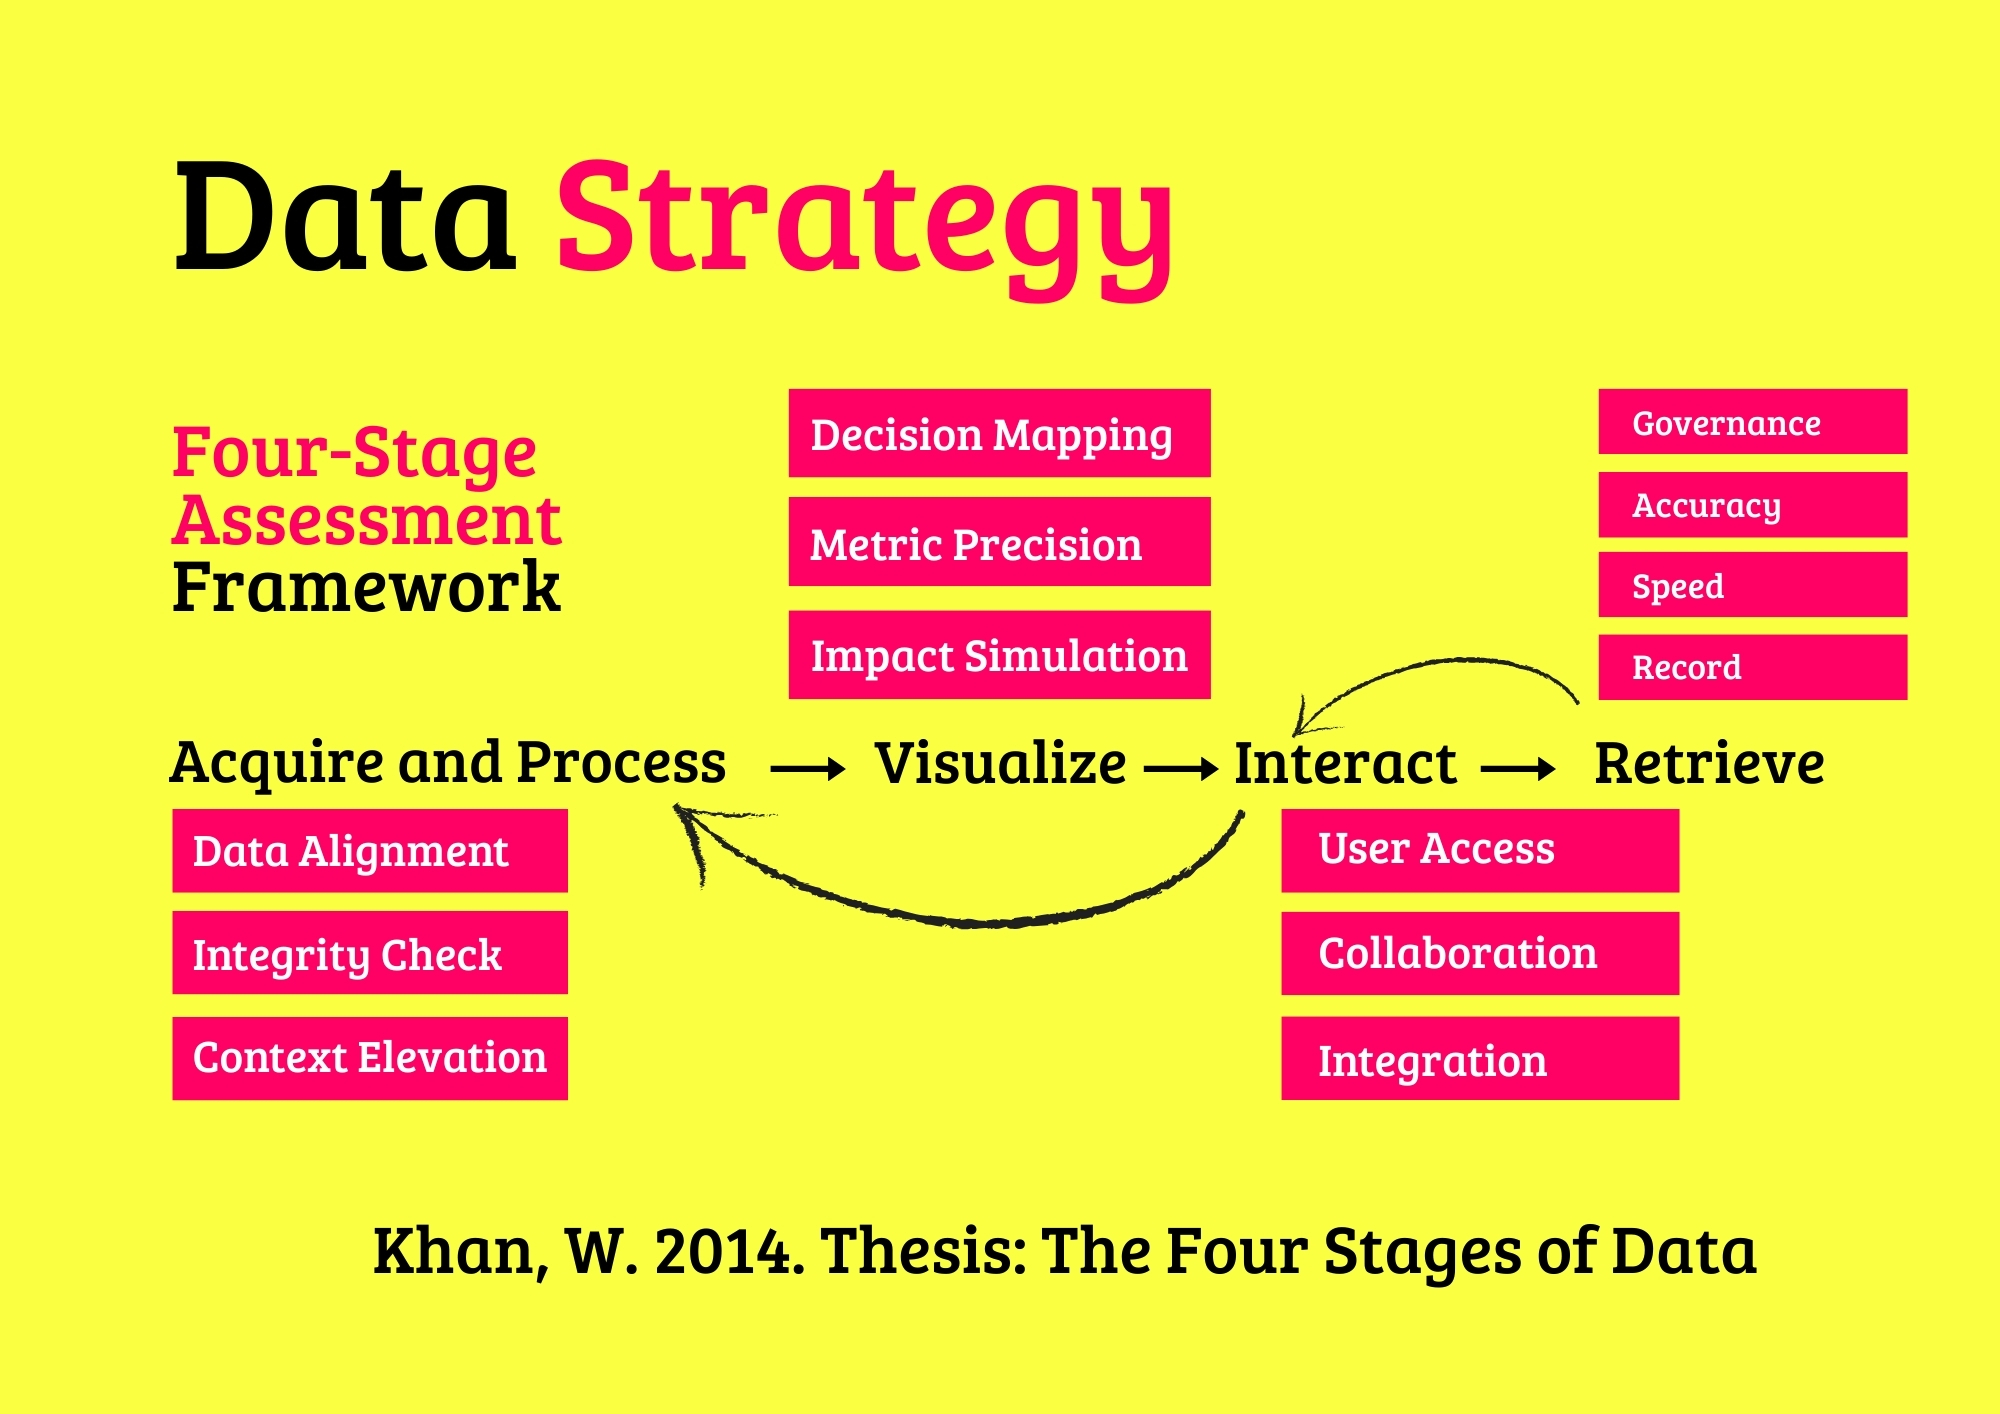
Safeguard your data with our four-stage supervision and assessment framework, ensuring robust, compliant, and ethical security practices for resilient organizational trust and protection.
Data and Machine Learning
Harness the power of data and machine learning with our four-stage supervision and assessment framework, delivering precise, ethical, and scalable AI solutions for transformative organizational impact.

AI Data Workshops
Empower your team with hands-on AI data skills through our four-stage workshop framework, ensuring practical, scalable, and ethical AI solutions for organizational success.
Data Engineering
Architect and optimize robust data platforms with our four-stage supervision and assessment framework, ensuring scalable, secure, and efficient data ecosystems for organizational success.
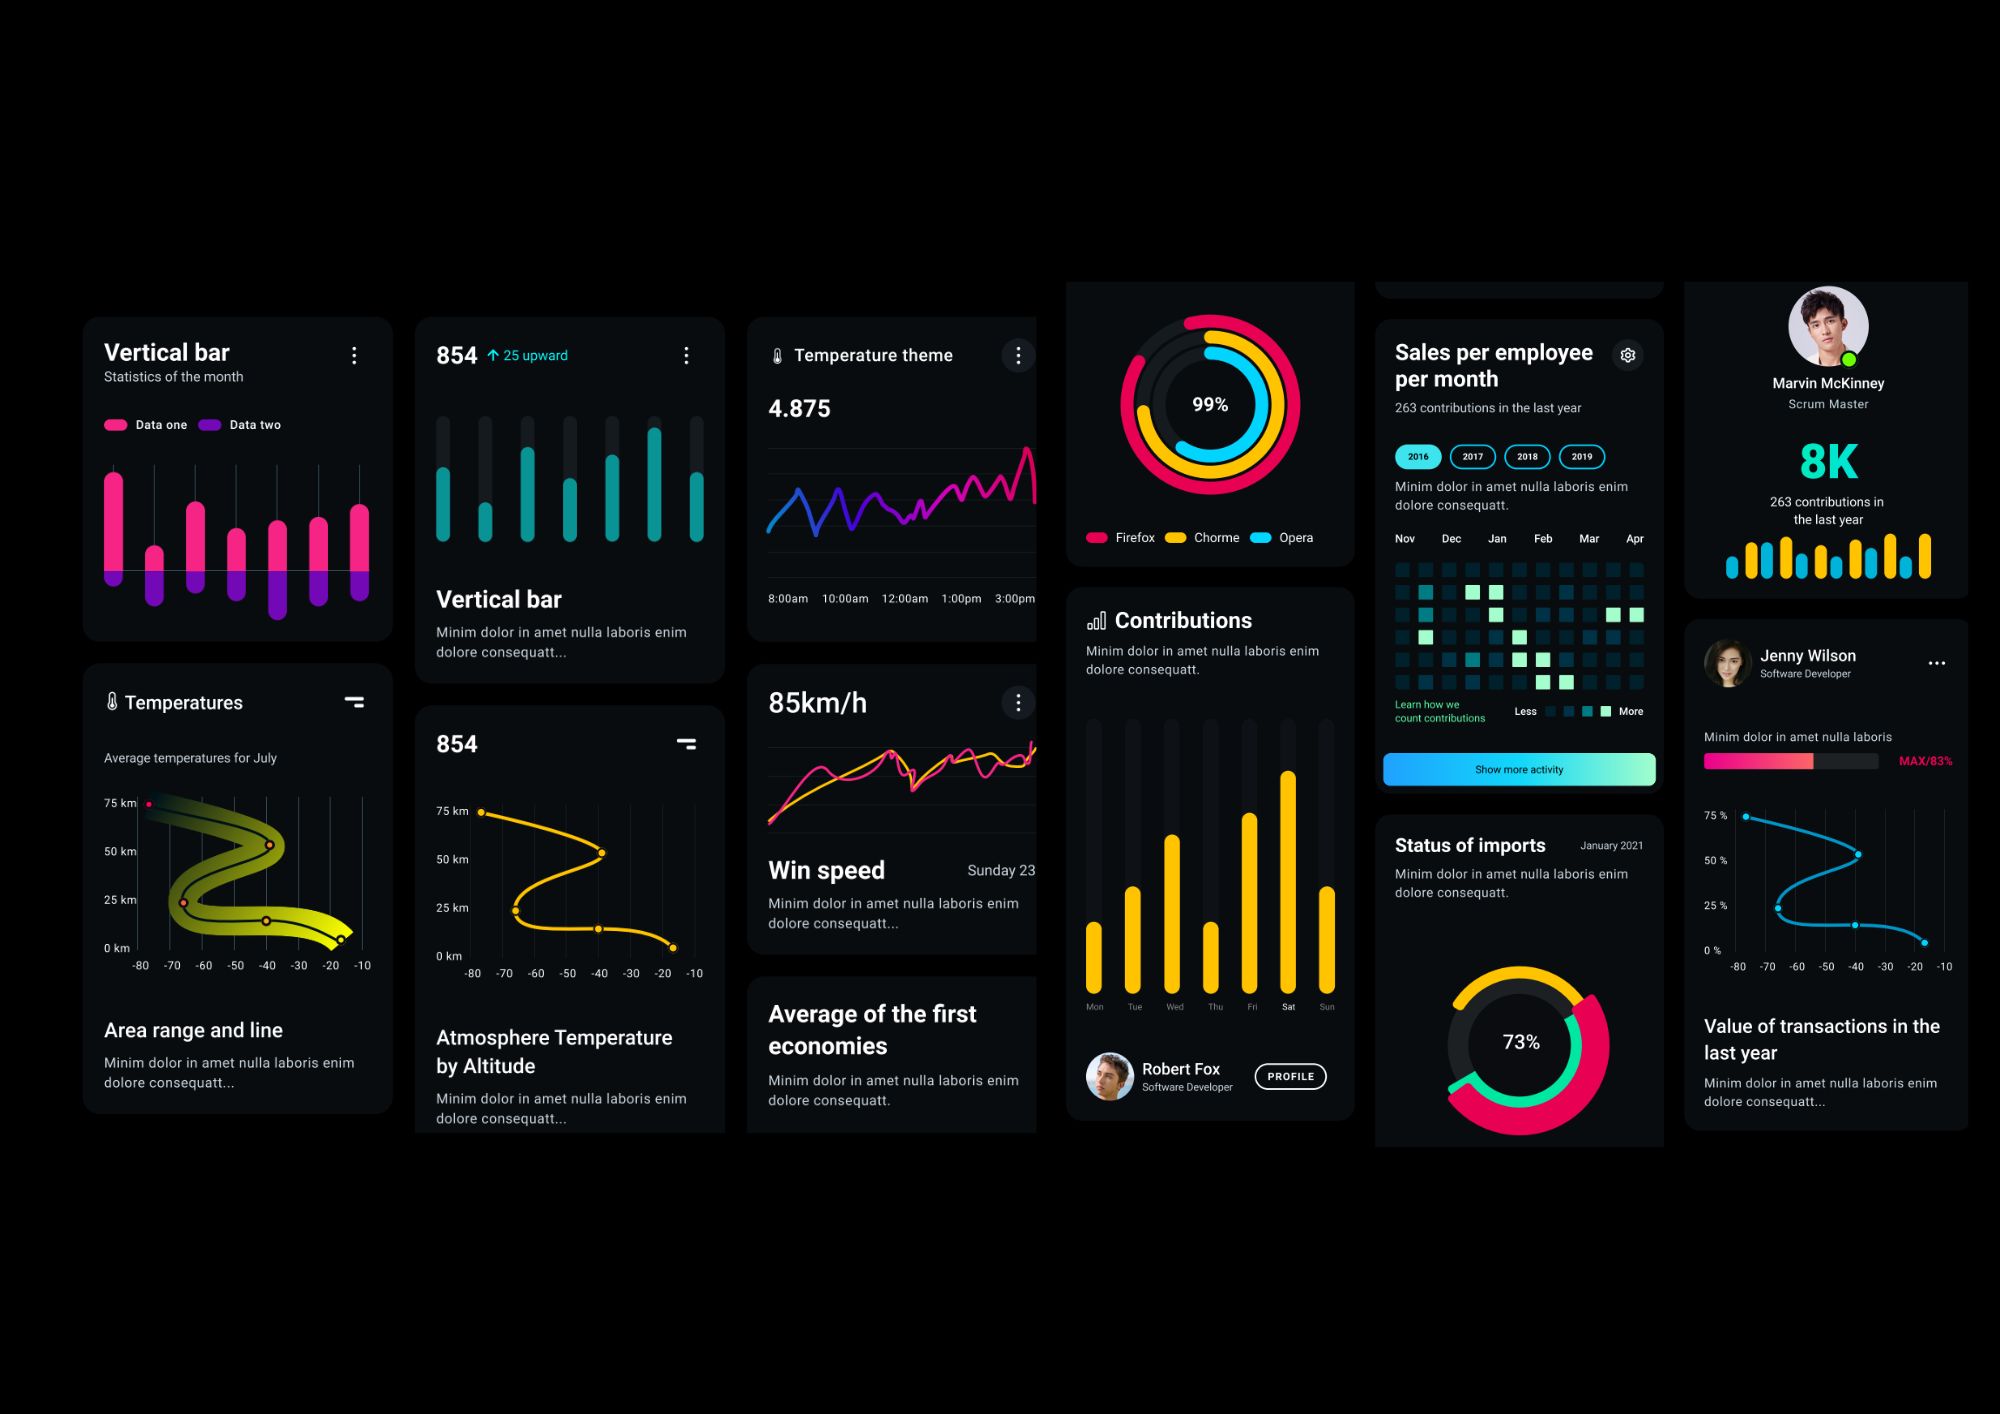
Data Visualization
Harness the power of visualization charts to transform complex datasets into actionable insights, enabling evidence-based decision-making across diverse organizational contexts.

Insights and Analytics
Transform complex data into actionable insights with advanced analytics, fostering evidence-based strategies for sustainable organizational success.
Data Strategy
Elevate your organization’s potential with our AI-enhanced data advisory services, delivering tailored strategies for sustainable success.
AI Business Agents in Action
Inbound AI Agent for Real-Time Enquiries
Caspia’s Inbound AI Agent now handles over 80 percent of first-contact enquiries, routing calls, chats, and emails instantly to the right departments and reducing response time to under 10 seconds.

Lena
Statistician
Outbound AI Agent for Proactive Engagement
The Outbound AI Agent connects with customers automatically through personalised calls and data-driven follow-ups, increasing conversion rates by 25 percent across multiple industries.

Eleane
AI Researcher
Predictive Analytics Behind Every Interaction
Each AI Business Agent uses predictive models that analyse behavioural data in real time, adapting tone, timing, and messaging for the highest impact.

Edmond
Mathematician
Web and Chat AI Agent for Customer Journeys
Deployed across websites and WhatsApp, Caspia’s Web and Chat AI Agent provides a seamless experience, answering questions, taking bookings, and completing secure payments 24 hours a day.

Sophia
Data Scientist
Voice and Telephony Integration
With native telephony integration, AI Agents can call clients directly, provide spoken updates, or schedule voice-based confirmations, linking natural language with data-driven logic.

Kam
Programmer
Connecting Business Data to Human Conversations
Every conversation handled by the AI Business Agent connects to live business data, allowing instant retrieval of order details, account balances, and workflow status without human intervention.

Jasmine
Data Analyst
Learning from Every Call
Each interaction trains the AI Business Agent further. Feedback loops allow it to identify recurring issues and propose workflow improvements automatically.

Jamie
AI Engineer
Reducing Operational Load
AI Business Agents now process up to 65 percent of transactional workloads that once required staff support, freeing human teams to focus on creative and strategic tasks.

Julia
Statistician
Seamless API and CRM Integration
Inbound and Outbound Agents connect directly to CRM and ERP systems through secure APIs, ensuring every call, chat, and transaction syncs instantly with enterprise records.

Felix
Data Engineer
Context-Aware Understanding
Unlike traditional bots, Caspia’s AI Agents interpret context, intent, and emotional tone, providing responses that align with both brand language and customer sentiment.

Mia
AI Researcher
Data-Driven Decision Layer
The AI Agent network connects analytics with action, drawing from company dashboards and data stores to decide and execute responses intelligently in real time.

Paul
Mathematician
Multilingual Communication
The Web and Chat AI Agent converses in over 25 languages and dialects, giving multinational clients a consistent and localised engagement channel.

Emilia
Data Scientist
Automating Repetitive Workflows
Outbound AI Agents handle reminders, renewals, and confirmations automatically. Businesses save hundreds of staff hours every quarter by automating these interactions.

Danny
Programmer
Transforming Data into Dialogue
With AI Business Agents, data isn’t just visualised, it’s spoken. The system can narrate insights from Power BI, Tableau, and Looker dashboards directly during meetings.

Charlotte
Data Analyst
Continuous Learning through Interaction
Every question, correction, and response becomes part of a continuous learning model that improves the AI Agent’s understanding and accuracy across all channels.

Squibb
AI Engineer
Trusted Enterprise Deployment
Caspia’s AI Business Agents operate on secure cloud infrastructure with role-based access, ensuring compliance with enterprise-grade data protection standards.

Sam
Statistician
Adaptive Response Framework
Inbound and Outbound AI Agents adjust their conversational flow dynamically using live metrics such as sentiment, response time, and customer satisfaction scores.

Larry
Mathematician
Real-Time Analytics Feedback
Every call and chat session generates structured analytics that can be fed back into dashboards, allowing executives to monitor engagement and performance continuously.

Tabs
Data Engineer
The Future of Business Interaction
AI Business Agents represent a shift from digital tools to autonomous enterprise assistants capable of thinking, learning, and communicating across every channel.

Mitchell
AI Researcher
Frequently Asked Questions
What exactly is an AI Business Agent?
An AI Business Agent is a virtual employee that can talk, write and act like a human. It handles calls, chats, bookings and customer support 24/7 in your brand voice. Each agent is trained on your data, workflows and tone to deliver accurate, consistent, and human-quality interactions.
How are AI Business Agents trained for my business?
We train each agent using your documentation, product data, call transcripts and FAQs. The agent learns to recognise customer intent, follow your processes, and escalate to human staff when required. Continuous retraining keeps performance accurate and up to date.
What makes AI Business Agents better than chatbots?
Unlike traditional chatbots, AI Business Agents use advanced language models, voice technology and contextual memory. They understand full conversations, manage complex requests, and speak naturally — creating a human experience without waiting times or errors.
Can AI Business Agents integrate with our existing tools?
Yes. We connect agents to your telephony, CRM, booking system and internal databases. Platforms like Twilio, WhatsApp, HubSpot, Salesforce and Google Workspace work seamlessly, allowing agents to perform real actions such as scheduling, updating records or sending follow-up emails.
How do you monitor and maintain AI Business Agents?
Our team provides 24/7 monitoring, quality checks and live performance dashboards. We retrain agents with new data, improve tone and accuracy, and ensure uptime across all communication channels. You always have full visibility and control.
What industries can benefit from AI Business Agents?
AI Business Agents are already used in healthcare, beauty, retail, professional services, hospitality and education. They manage appointments, take orders, answer enquiries, and follow up with customers automatically — freeing staff for higher-value work.
How secure is our data when using AI Business Agents?
We apply strict data governance including encryption, access control and GDPR compliance. Each deployment runs in secure cloud environments with audit logs and permission-based data access to protect customer information.
Do you still offer data and analytics services?
Yes. Data remains the foundation of every AI Business Agent. We design strategies, pipelines and dashboards in Power BI, Tableau and Looker to measure performance and reveal new opportunities. Clean, structured data makes AI agents more intelligent and effective.
What ongoing support do you provide?
Every client receives continuous optimisation, analytics reviews and strategy sessions. We track performance, monitor response quality and introduce updates as your business evolves — ensuring your AI Business Agents stay aligned with your goals.
Can you help us combine AI with our existing team?
Absolutely. Our approach is hybrid: AI agents handle repetitive, time-sensitive tasks, while your human staff focus on relationship-building and creative work. Together they create a seamless, scalable customer experience.
