Inbox Data Insights (IDI)
No matter the size of your email archive, IDI enables you to explore, safeguard, and leverage every message.
Email Archives
Inside your email inbox lies a rich history of conversations, key documents, and client insights alongside hidden security threats. Still, most of this data stays dormant, disconnected, or at risk.
- Do you know which employees drive communication or how internal tone shifts over time?
- Is your team protected from deceptive email threats that blend in with legitimate traffic?
- How effectively can you scan inboxes for signs of trouble or strategic insights?
Caspia’s Inbox Data Insights (IDI) solution is built to solve these exact problems—at scale.
Whether you’re dealing with 100MB of email or 1 Terabyte across hundreds of accounts, IDI makes every byte count.
What Is Inbox Data Insights (IDI)?
Behind every email is a person, a tone, a motive, and a relationship. IDI (a data service ingests and analyzes .mbox) reads between the lines to extract behavioral insights that charts, dashboards, and file systems cannot predict.
What You Can Do with IDI:
- Export customer and top communicator lists as clean, verified CSV files.
- AI-driven email list verification and validation for accurate, risk-free contacts.
- Phishing and spam detection with detailed PDF threat reports and CSV alerts.
- Anomaly detection delivering comprehensive PDF and CSV logs of suspicious activity.
- Timeline and compliance reports exportable as multi-page (4 to 52) PDFs for audits.
Why Companies Choose IDI
IDI offers a managed email data service that delivers enterprise intelligence by analyzing your archived inbox data. Organizations rely on IDI for accurate insights and secure handling without the overhead of managing software.
Core Advantages:
✅ Enterprise Scale
Efficiently processes email archives ranging from hundreds of megabytes to terabytes in size.
✅ Actionable Intelligence
Identifies key communicators, topic trends, sentiment shifts, and uncovers hidden risks within email data.
✅ Strict Security Measures
Implements encryption, malware scanning, and adheres to data privacy regulations.
✅ Customizable Deliverables
Exports verified data to CSV and generates detailed PDF reports for legal, compliance, and executive use.
How IDI Transforms Your Email Data
| Feature | What It Does | Scale-Ready Capabilities | Security & Export Options |
|---|---|---|---|
| Email Header Parsing | Extracts metadata like sender, recipient, time, IP, and client. | Handles millions of records efficiently. | CSV for metadata, flag spoofed headers. |
| Timeline & Trend Analysis | Visualizes message volume over hours/days/months. | Scalable heatmaps and trend graphs. | CSV & PDF, flags phishing surges. |
| Phishing & Spam Detection | AI-driven detection of spoofing, urgent tone, blacklisted domains. | Built for real-time scanning of TB-scale datasets. | Detailed PDF threat reports, CSV alerts. |
| Keyword & Phrase Analytics | Track sentiment shifts, urgent or risky language. | NLP engine scales with dataset size. | PDF & CSV with context snippets. |
| Attachment Metadata Analysis | Catalogs, classifies, and scans all attachments. | Photos, PDFs, videos supported. | Media threat scans; metadata CSV exports. |
| Top Communicators | Identifies most active senders and receivers. | Ranks by volume, urgency, and domain trust. | Exportable leaderboards in CSV. |
| Conversation Mapping | Reconstructs threads across email chains. | Full thread visualization. | Detects hijacks, PDF storyboards. |
| Topic Clustering | Automatically groups messages by themes. | Unsupervised learning adapts to data volume. | Custom cluster PDFs or CSV. |
| Geolocation Extraction | Pulls IP & metadata-based location points. | Global-scale mapping, flags risk zones. | CSV & geolocation heatmaps in PDF. |
| Response Time Metrics | Tracks time to reply across contacts or teams. | Useful for performance & phishing detection. | Trend line PDFs, export raw data. |
| Anomaly Detection | Flags outliers in timing, volume, or sender behavior. | Scalable to petabyte email ecosystems. | AI-based flagging, full anomaly log CSV/PDF. |
| Email Classification | Categorizes (personal, spam, corporate, vendor). | Fine-tuned with custom categories. | Segment reports in CSV or PDF. |
| Custom Dashboard Views | Interactive web-based visualizations. | Drill into 1M+ messages with zero lag. | Exports available per role. |
| Compliance Audit Trail | Documents every step, for GDPR/CCPA/ISO27001. | Compliant from ingestion to deletion. | PDF-based audit summaries. |
| Data Destruction Report | Securely deletes all data post-analysis. | Cryptographic wipe (NIST 800-88). | Certified destruction report PDF. |
Use Cases Across Industries
📊 Enterprise Intelligence
Uncover internal knowledge flows, sales funnel inefficiencies, or organizational bottlenecks—all from inbox data.
⚖️ Legal Discovery & Compliance
Streamline email audits. Find evidence. Ensure GDPR and CCPA readiness with structured and secure reporting.
🛡️ Cybersecurity & Threat Response
Preempt phishing attacks, detect spoofing, and isolate compromised accounts before damage is done.
🤝 Customer Engagement Insights
Analyze tone, frequency, and topics from client conversations. Improve support, refine messaging, and reduce churn.
🏢 HR and Internal Ops
Understand employee communication patterns, manager response rates, and departmental bottlenecks.
From Small Teams to Global Enterprises
Whether you’re a growing startup with a few gigabytes of archived email or a multinational corporation managing terabytes of inbox data, IDI grows with you.
- Built for .mbox formats (including nested or messy data structures).
- Supports structured/unstructured data from legacy platforms and modern providers.
- Fast ingestion speeds and parallel processing architecture.
Security Foundation
With Caspia, your data is protected every step of the way:
- 🔒 AES-256 encryption in transit and at rest
- 📜 Full audit logs and chain-of-custody
- 💣 Cryptographic wipe (NIST 800-88) upon request
- 🧠 No AI model training on client data—your data stays yours
PDF & CSV Output Options
📄 PDF Reports
From compact executive summaries (4 pages) to deep-dive forensics (52 pages), each report is structured for clarity and insight.
📊 CSV Exports
Bring data into your BI dashboards, compliance systems, or forensic tools with clean, labeled CSV files from every analysis feature.
Ready to See Your Inbox in a New Light?
If you’re ready to stop guessing and start knowing what’s inside your inboxes—now is the time.
Inbox Data Insights (IDI) isn’t just a tool. It’s a strategic advantage.
📧 Contact us at hello@caspia.co.uk
Don’t let critical insights, threats, or opportunities sit unseen in your inbox.
With IDI, your email data becomes your competitive edge.
We're Here to Help!
Inbox Data Insights (IDI)
Turn email chaos into intelligence. Analyze, visualize, and secure massive volumes of inbox data with Inbox Data Insights (IDI) by Caspia.

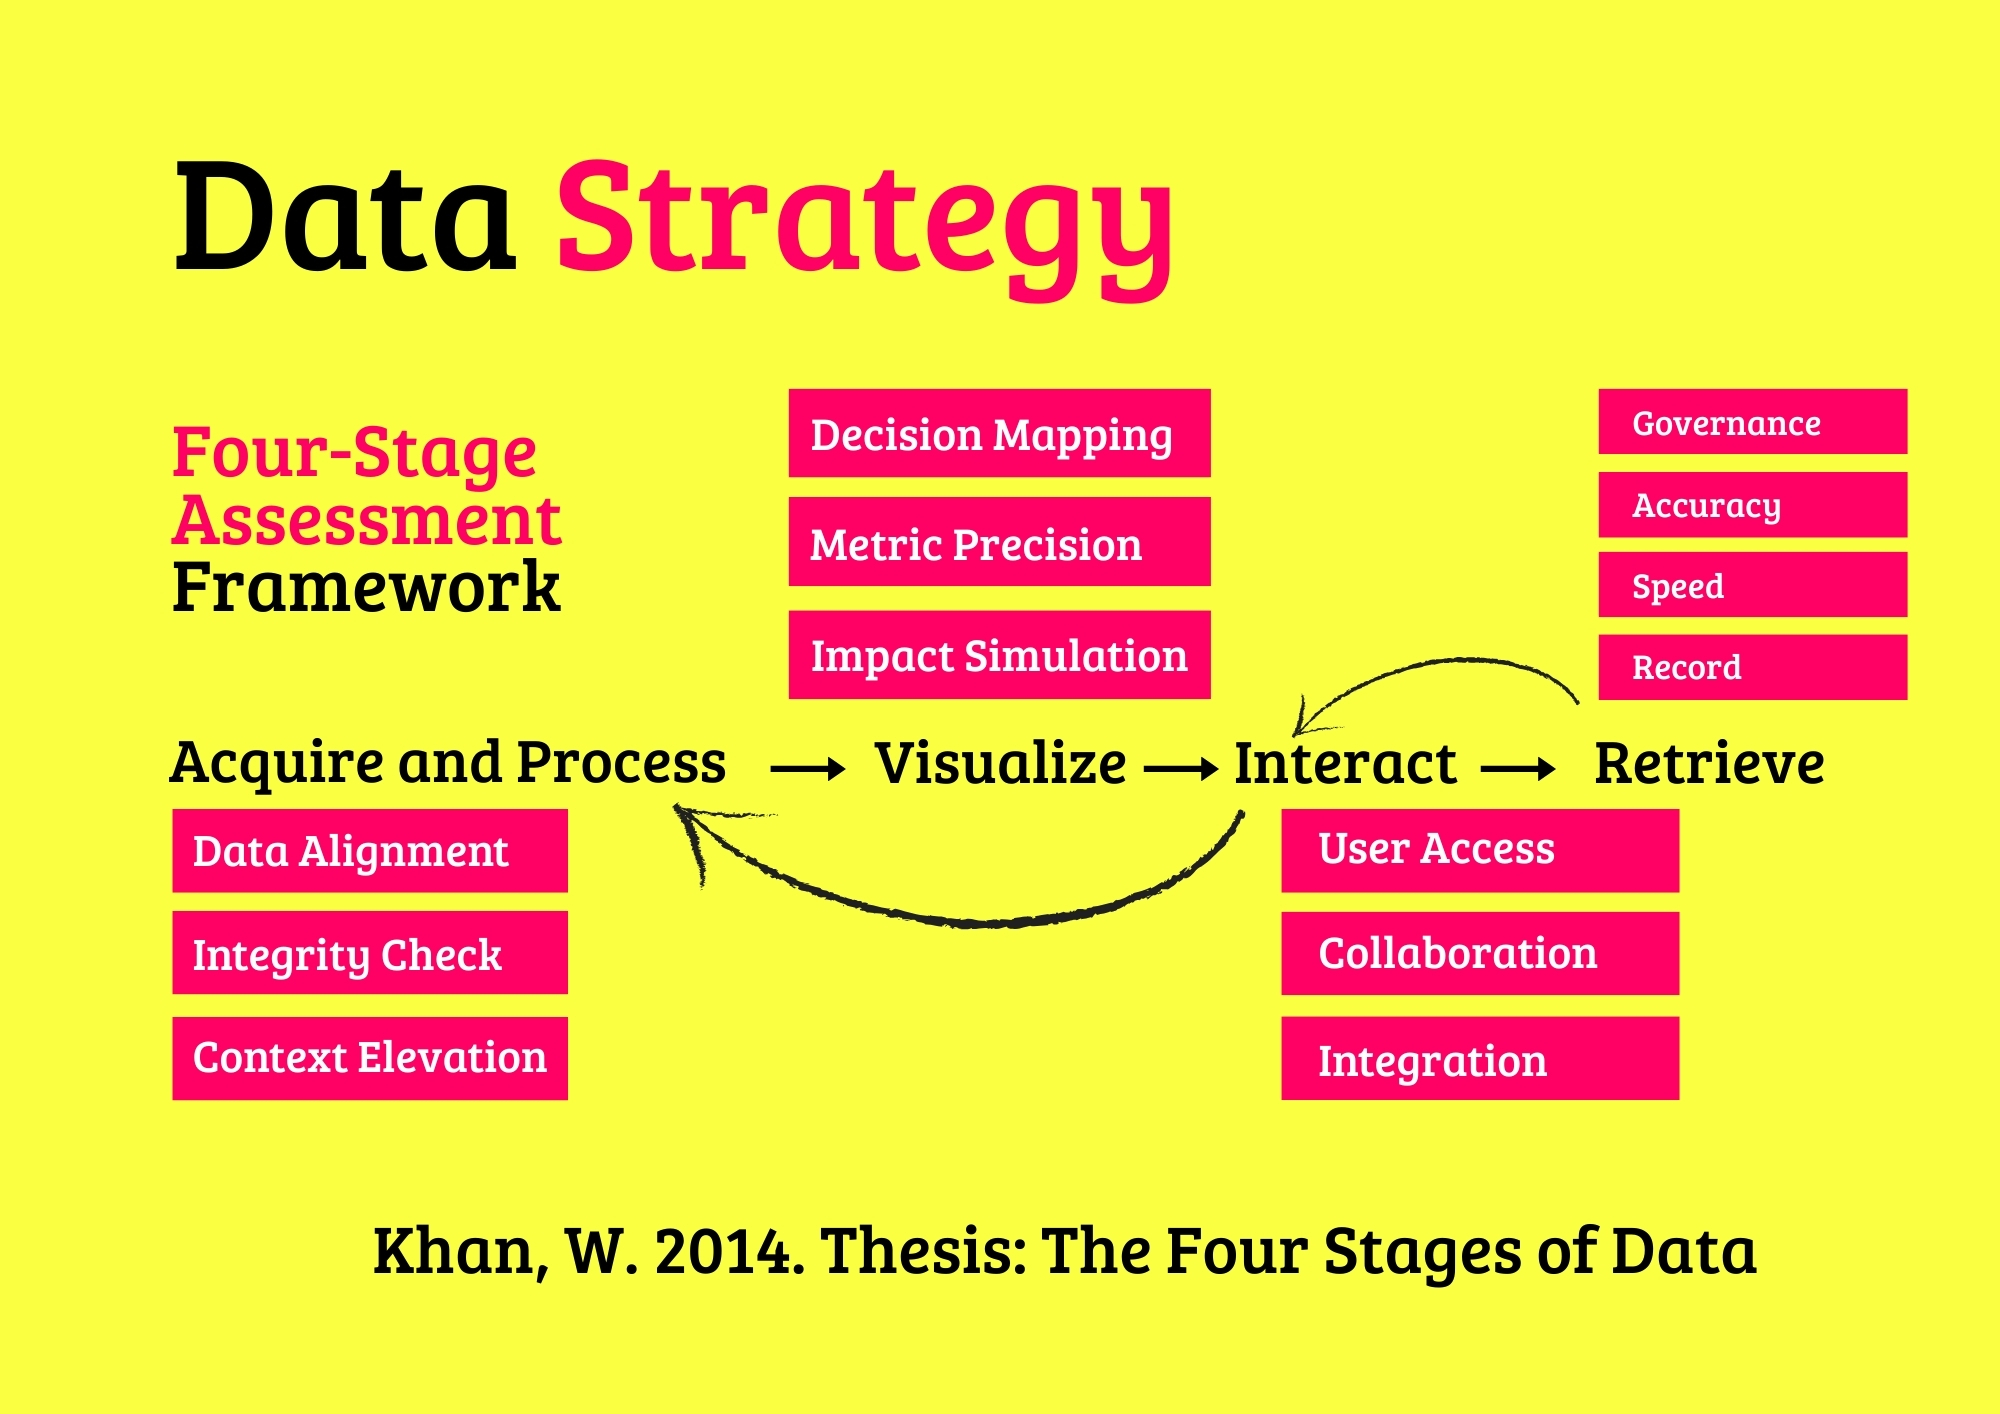
Data Security
Safeguard your data with our four-stage supervision and assessment framework, ensuring robust, compliant, and ethical security practices for resilient organizational trust and protection.

Data and Machine Learning
Harness the power of data and machine learning with our four-stage supervision and assessment framework, delivering precise, ethical, and scalable AI solutions for transformative organizational impact.

AI Data Workshops
Empower your team with hands-on AI data skills through our four-stage workshop framework, ensuring practical, scalable, and ethical AI solutions for organizational success.

Data Engineering
Architect and optimize robust data platforms with our four-stage supervision and assessment framework, ensuring scalable, secure, and efficient data ecosystems for organizational success.
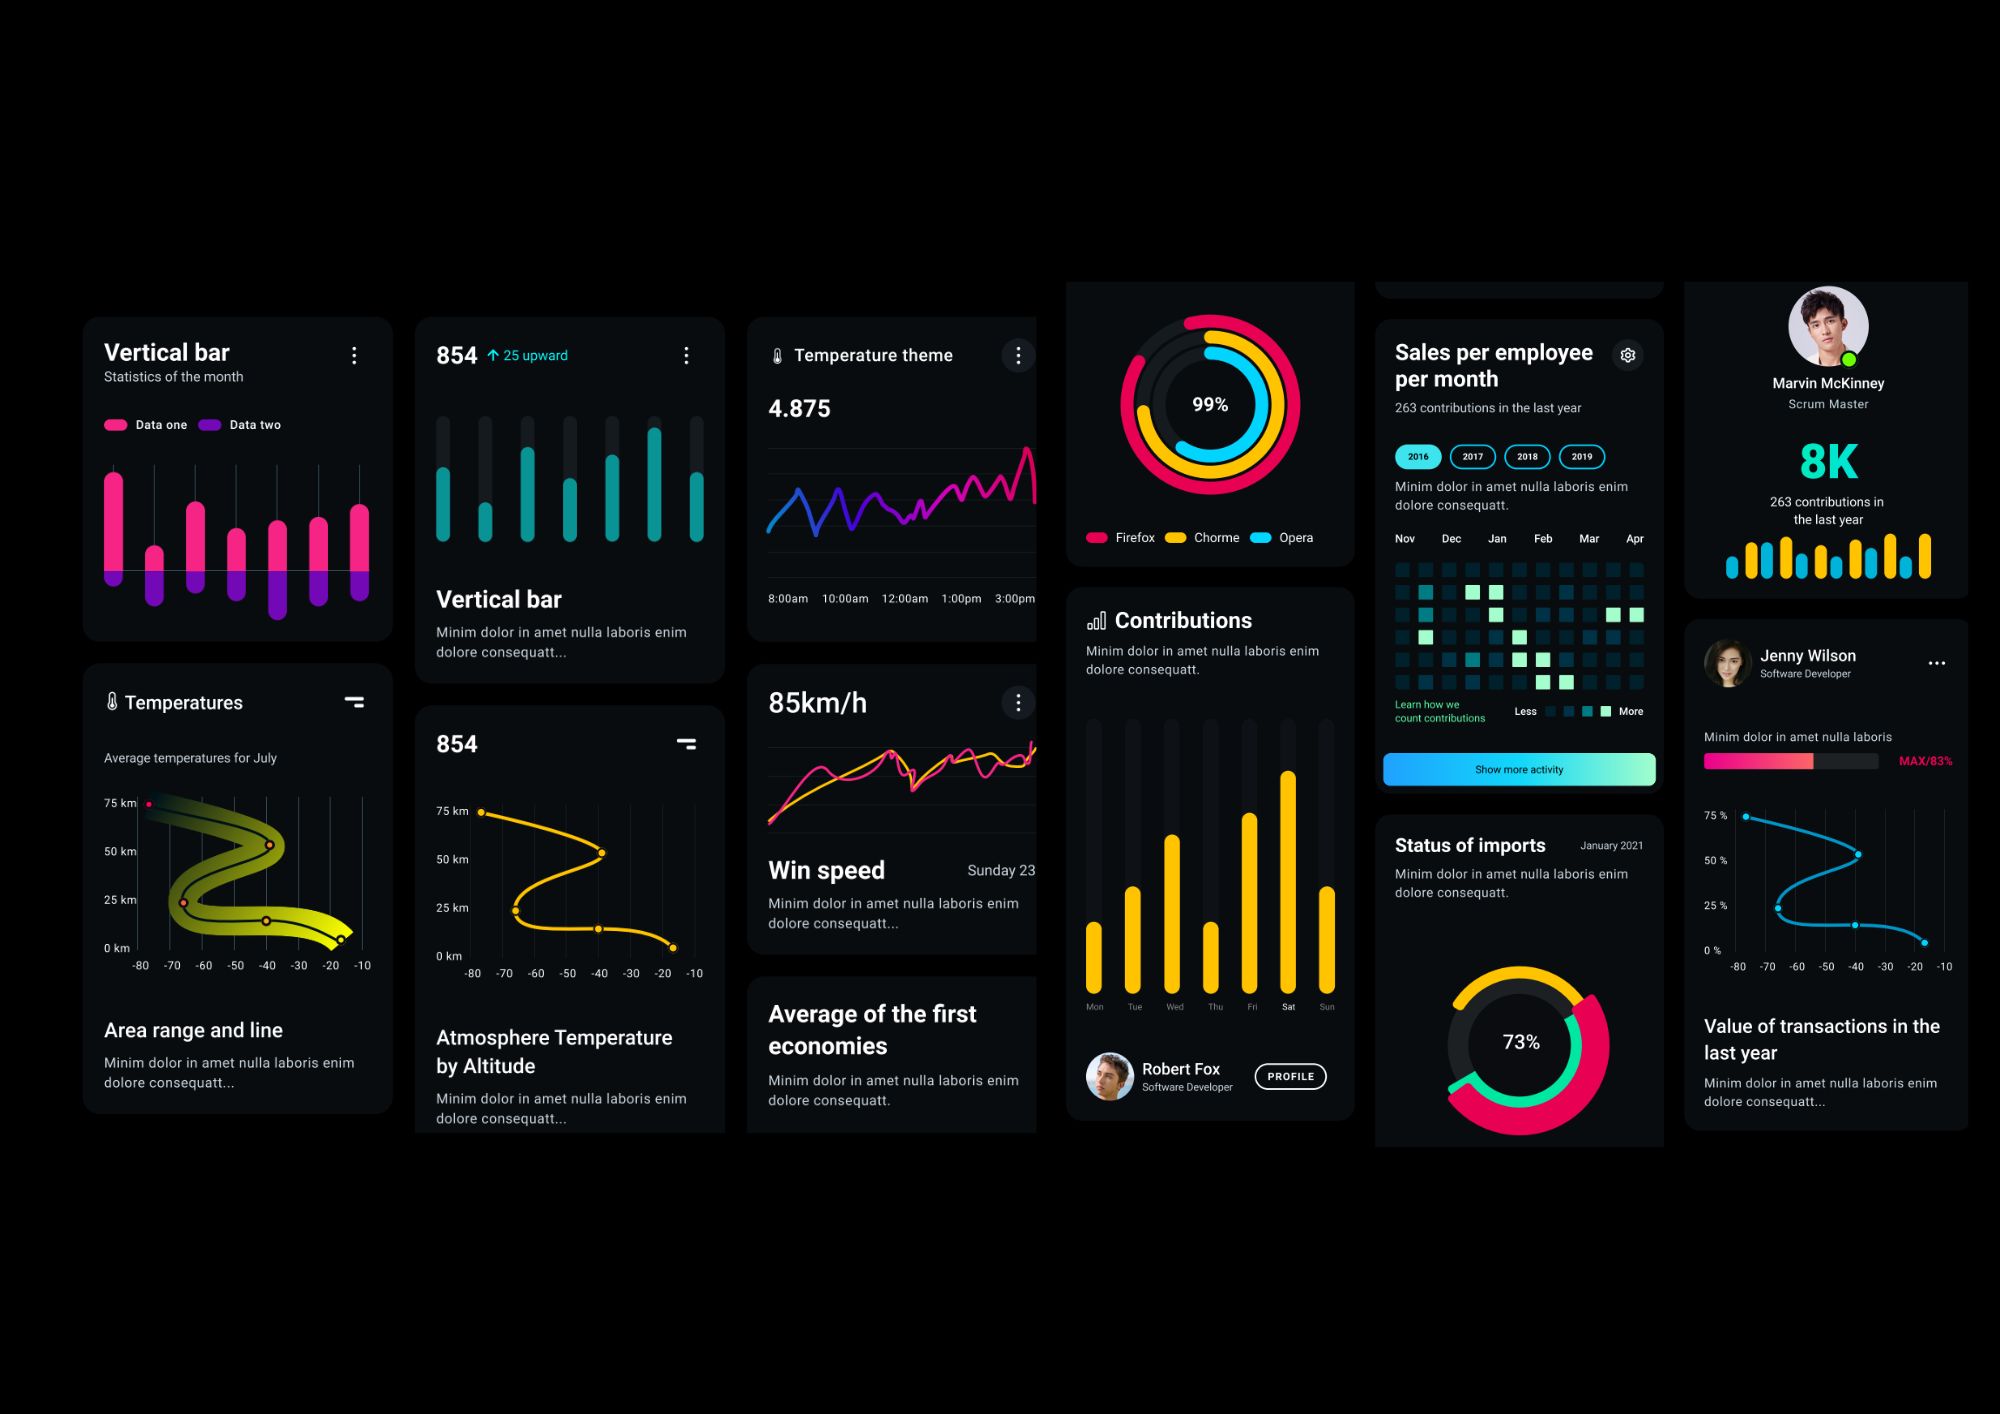
Data Visualization
Harness the power of visualization charts to transform complex datasets into actionable insights, enabling evidence-based decision-making across diverse organizational contexts.

Insights and Analytics
Transform complex data into actionable insights with advanced analytics, fostering evidence-based strategies for sustainable organizational success.
Data Strategy
Elevate your organization’s potential with our AI-enhanced data advisory services, delivering tailored strategies for sustainable success.
AI Business Agents in Action
Inbound AI Agent for Real-Time Enquiries
Caspia’s Inbound AI Agent now handles over 80 percent of first-contact enquiries, routing calls, chats, and emails instantly to the right departments and reducing response time to under 10 seconds.

Lena
Statistician
Outbound AI Agent for Proactive Engagement
The Outbound AI Agent connects with customers automatically through personalised calls and data-driven follow-ups, increasing conversion rates by 25 percent across multiple industries.

Eleane
AI Researcher
Predictive Analytics Behind Every Interaction
Each AI Business Agent uses predictive models that analyse behavioural data in real time, adapting tone, timing, and messaging for the highest impact.

Edmond
Mathematician
Web and Chat AI Agent for Customer Journeys
Deployed across websites and WhatsApp, Caspia’s Web and Chat AI Agent provides a seamless experience, answering questions, taking bookings, and completing secure payments 24 hours a day.

Sophia
Data Scientist
Voice and Telephony Integration
With native telephony integration, AI Agents can call clients directly, provide spoken updates, or schedule voice-based confirmations, linking natural language with data-driven logic.

Kam
Programmer
Connecting Business Data to Human Conversations
Every conversation handled by the AI Business Agent connects to live business data, allowing instant retrieval of order details, account balances, and workflow status without human intervention.

Jasmine
Data Analyst
Learning from Every Call
Each interaction trains the AI Business Agent further. Feedback loops allow it to identify recurring issues and propose workflow improvements automatically.

Jamie
AI Engineer
Reducing Operational Load
AI Business Agents now process up to 65 percent of transactional workloads that once required staff support, freeing human teams to focus on creative and strategic tasks.

Julia
Statistician
Seamless API and CRM Integration
Inbound and Outbound Agents connect directly to CRM and ERP systems through secure APIs, ensuring every call, chat, and transaction syncs instantly with enterprise records.

Felix
Data Engineer
Context-Aware Understanding
Unlike traditional bots, Caspia’s AI Agents interpret context, intent, and emotional tone, providing responses that align with both brand language and customer sentiment.

Mia
AI Researcher
Data-Driven Decision Layer
The AI Agent network connects analytics with action, drawing from company dashboards and data stores to decide and execute responses intelligently in real time.

Paul
Mathematician
Multilingual Communication
The Web and Chat AI Agent converses in over 25 languages and dialects, giving multinational clients a consistent and localised engagement channel.

Emilia
Data Scientist
Automating Repetitive Workflows
Outbound AI Agents handle reminders, renewals, and confirmations automatically. Businesses save hundreds of staff hours every quarter by automating these interactions.

Danny
Programmer
Transforming Data into Dialogue
With AI Business Agents, data isn’t just visualised, it’s spoken. The system can narrate insights from Power BI, Tableau, and Looker dashboards directly during meetings.

Charlotte
Data Analyst
Continuous Learning through Interaction
Every question, correction, and response becomes part of a continuous learning model that improves the AI Agent’s understanding and accuracy across all channels.

Squibb
AI Engineer
Trusted Enterprise Deployment
Caspia’s AI Business Agents operate on secure cloud infrastructure with role-based access, ensuring compliance with enterprise-grade data protection standards.

Sam
Statistician
Adaptive Response Framework
Inbound and Outbound AI Agents adjust their conversational flow dynamically using live metrics such as sentiment, response time, and customer satisfaction scores.

Larry
Mathematician
Real-Time Analytics Feedback
Every call and chat session generates structured analytics that can be fed back into dashboards, allowing executives to monitor engagement and performance continuously.

Tabs
Data Engineer
The Future of Business Interaction
AI Business Agents represent a shift from digital tools to autonomous enterprise assistants capable of thinking, learning, and communicating across every channel.

Mitchell
AI Researcher
Frequently Asked Questions
What exactly is an AI Business Agent?
An AI Business Agent is a virtual employee that can talk, write and act like a human. It handles calls, chats, bookings and customer support 24/7 in your brand voice. Each agent is trained on your data, workflows and tone to deliver accurate, consistent, and human-quality interactions.
How are AI Business Agents trained for my business?
We train each agent using your documentation, product data, call transcripts and FAQs. The agent learns to recognise customer intent, follow your processes, and escalate to human staff when required. Continuous retraining keeps performance accurate and up to date.
What makes AI Business Agents better than chatbots?
Unlike traditional chatbots, AI Business Agents use advanced language models, voice technology and contextual memory. They understand full conversations, manage complex requests, and speak naturally — creating a human experience without waiting times or errors.
Can AI Business Agents integrate with our existing tools?
Yes. We connect agents to your telephony, CRM, booking system and internal databases. Platforms like Twilio, WhatsApp, HubSpot, Salesforce and Google Workspace work seamlessly, allowing agents to perform real actions such as scheduling, updating records or sending follow-up emails.
How do you monitor and maintain AI Business Agents?
Our team provides 24/7 monitoring, quality checks and live performance dashboards. We retrain agents with new data, improve tone and accuracy, and ensure uptime across all communication channels. You always have full visibility and control.
What industries can benefit from AI Business Agents?
AI Business Agents are already used in healthcare, beauty, retail, professional services, hospitality and education. They manage appointments, take orders, answer enquiries, and follow up with customers automatically — freeing staff for higher-value work.
How secure is our data when using AI Business Agents?
We apply strict data governance including encryption, access control and GDPR compliance. Each deployment runs in secure cloud environments with audit logs and permission-based data access to protect customer information.
Do you still offer data and analytics services?
Yes. Data remains the foundation of every AI Business Agent. We design strategies, pipelines and dashboards in Power BI, Tableau and Looker to measure performance and reveal new opportunities. Clean, structured data makes AI agents more intelligent and effective.
What ongoing support do you provide?
Every client receives continuous optimisation, analytics reviews and strategy sessions. We track performance, monitor response quality and introduce updates as your business evolves — ensuring your AI Business Agents stay aligned with your goals.
Can you help us combine AI with our existing team?
Absolutely. Our approach is hybrid: AI agents handle repetitive, time-sensitive tasks, while your human staff focus on relationship-building and creative work. Together they create a seamless, scalable customer experience.
