What Your Email Inbox Knows About You (That You Don’t)

Explore how your email inbox, a modern replacement for letters and ledgers, reveals hidden insights about your habits, preferences, and professional life through data analysis and industry trends.
What Your Email Inbox Knows About You (That You Don’t)

What Your Email Inbox Knows

Your email inbox is a sneaky gossip, hoarding details about your life that would make your diary blush. That 2 AM reply to your boss? It knows you’re a workaholic.

Those cat meme newsletters you secretly love? It’s onto you.

Since Ray Tomlinson fired off the first networked email in 1971, this digital heir to handwritten letters and dusty ledgers has taken over the world.

In 2025, 4.7 billion people sling 376 billion emails daily.

Your inbox isn’t just a tool—it’s a digital spy, piecing together your habits, dramas, and guilty pleasures. Let’s crack it open and hear what it’s whispering.

From Parchment to Pixels

Back when people scratched letters with quills, replies took weeks. Businesses logged deals in ledgers, praying the ink didn’t smudge. Then email strutted in—fast, searchable, and gloriously paper-free.

By the 1990s, it had crushed faxes; by the 2000s, Gmail’s slick cloud storage turned inboxes into digital vaults.

Today, your inbox holds everything: work rants, breakup drafts, and that dodgy “free iPhone” scam you almost fell for.

Why does email rule? It’s instant, versatile, and tracks your every move.

You can fire off a contract, flirt with emojis, or rage-delete spam in seconds.

The average person spends 28% of their workday on email, sending 40 and receiving 120 daily (McKinsey, 2024).

Your inbox is a time capsule of your life—typos, regrets, and all.

Who’s Flooding Your Inbox?

Email powers work, but some industries are downright chatty. Software nerds and corporate bigwigs lead the pack, while marketers drown you in “last chance” deals. Here’s who’s clogging the world’s inboxes in 2025, with volumes and vibes.

Industry Est. Daily Email Volume (Global) Primary Use Case Cheeky Insight
Software Engineering 45 billion Code rants, Jira pings, nerd debates Devs write 300-word essays about one bug, then vanish for a week.
Professional Services (Legal, Consulting) 38 billion Client wooing, contract marathons Lawyers send 50-page PDFs named “Final_v2.pdf” and call it organisation.
Sales & Marketing 90 billion Cold pitches, “just checking in” 80% of these start with “Hope you’re well” (spoiler: you’re not).
Retail & E-commerce 75 billion Order receipts, flash sale spam That “abandoned cart” email hits before you even close the tab.
Healthcare 20 billion Patient nudges, staff memos Emails so secure, they’re basically written in hieroglyphs.

Industry

Software Engineering: Devs live in their inboxes, arguing over code in threads longer than a Marvel movie.

65% admit to snarky “per my last email” replies (Stack Overflow, 2024).

Professional Services: Lawyers and consultants craft epic emails, signing off with “best regards” like it’s a royal decree.

Their inboxes are chaos—unread “urgent” emails pile up like laundry.

Sales & Marketing: Marketers send 10 emails per sale, tracking your every click.

Ever get a “we miss you” from a shop you visited once? That’s their desperation talking.

Retail & E-commerce: Your inbox swims in “20% off!” screams, but order confirmations steal the show—80% open rate, because who doesn’t stalk their package?

Healthcare: Emails here are locked tighter than Fort Knox, but staff still sneak in “funny cat video” forwards when no one’s watching.

A Day in the Drama

Your inbox is a soap opera starring you.

A typical day’s emails read like a sitcom script:

9:05 AM: Boss emails, “Quick call?” (It’s an hour.)
10:30 AM: Colleague forwards a 25-person thread with “Thoughts?” and zero context.
1:50 PM: Amazon confirms your impulse buy—a llama-shaped lamp.
3:20 PM: You reply-all with “Haha, love it!” and die inside.
12:01 AM: You’re typing “Sorry for the delay” to an email from last month.

These threads spill your soul.

That 3 AM reply screams workaholic. Your 60 unread LinkedIn invites? Social ghosting. The 15 emails to fix one typo? You’re a perfectionist in panic mode.

What Your Inbox Is Hiding

Your inbox is a digital detective, stitching together your life like a creepy novelist. Here’s what it’s got on you:
Your Routine: Late replies or 1 AM emails peg you as a night owl or stressed. Gmail knows you answer work emails faster than your best mate’s.

Your Vibe: AI reads your tone—breezy “Cheers!” to clients, blunt “K” to mates. Too many “urgent” emails? You’re a stress ball.

Your Weaknesses: Clicking “Top 10 Dog Memes” betrays your procrastination. Retailers know you can’t resist a “buy one, get one” deal.

Your Work Chaos: Endless “please advise” threads hint at office drama. HR might flag your 20-hour email marathons for a burnout chat.

Your Risks: That “free cruise” link you nearly clicked? Your inbox knows you’re one bad day from a phishing scam.

Gmail’s Smart Replies (“Looks great!”) are powered by scanning your emails—creepy but clever.

A typical inbox holds 15,000 emails, each with metadata (timestamps, locations) that could chart your life. Try Google Takeout to see it all—your inbox knows you better than your mum.

Take Back Your Inbox

Your inbox is a goldmine for companies.

Marketers use your clicks to sell you more lamps; bosses track your email load to spot burnout. But you can outsmart it:

Clean House: Use Clean Email to zap spam. Unsubscribe from that gym you never joined.

Get Insights: Outlook’s MyAnalytics spills your email habits—like spending 3 hours daily on “urgent” threads.

Lock It Up: Enable 2FA, dodge sketchy links, and never email your PIN.

Own Your Time: Set filters to prioritise VIPs and mute the noise. Schedule “email hours” to escape the inbox trap.

Know the Score: Google mines your emails for ads.

Opt out of ad personalisation in settings to keep them guessing.

Your email inbox is a cheeky snitch, spilling your secrets while posing as a humble tool. From its rise as a letter-slayer to its reign as a data emperor, it’s captured your life—typos, llama lamps, and all.

Devs, marketers, and retailers keep it humming, but it’s your story it’s telling. So, dive in, laugh at your reply-all disasters, and take charge.

Your inbox may know you, but you can play it at its own game.


🔍 Email Intelligence for Strategic Decision-Making

Ready to take control of what your inbox reveals?

Caspia’s Inbox Data Insights (IDI) service helps organisations uncover powerful patterns and strategic insights hidden in both structured and unstructured email content.

Transform your inbox into a source of intelligence—enhance decision-making, boost operational clarity, and reveal what truly drives your workflows.

➡️ Explore Caspia IDI Now


What Your Email Inbox Knows About You (That You Don’t)
Inbox Data Insights (IDI)

Inbox Data Insights (IDI)

Turn email chaos into intelligence. Analyze, visualize, and secure massive volumes of inbox data with Inbox Data Insights (IDI) by Caspia.

Data Security

Data Security

Safeguard your data with our four-stage supervision and assessment framework, ensuring robust, compliant, and ethical security practices for resilient organizational trust and protection.

Data and Machine Learning

Data and Machine Learning

Harness the power of data and machine learning with our four-stage supervision and assessment framework, delivering precise, ethical, and scalable AI solutions for transformative organizational impact.

AI Data Workshops

AI Data Workshops

Empower your team with hands-on AI data skills through our four-stage workshop framework, ensuring practical, scalable, and ethical AI solutions for organizational success.

Data Engineering

Data Engineering

Architect and optimize robust data platforms with our four-stage supervision and assessment framework, ensuring scalable, secure, and efficient data ecosystems for organizational success.

Data Visualization

Data Visualization

Harness the power of visualization charts to transform complex datasets into actionable insights, enabling evidence-based decision-making across diverse organizational contexts.

Insights and Analytics

Insights and Analytics

Transform complex data into actionable insights with advanced analytics, fostering evidence-based strategies for sustainable organizational success.

Data Strategy

Data Strategy

Elevate your organization’s potential with our AI-enhanced data advisory services, delivering tailored strategies for sustainable success.

We're Here to Help!

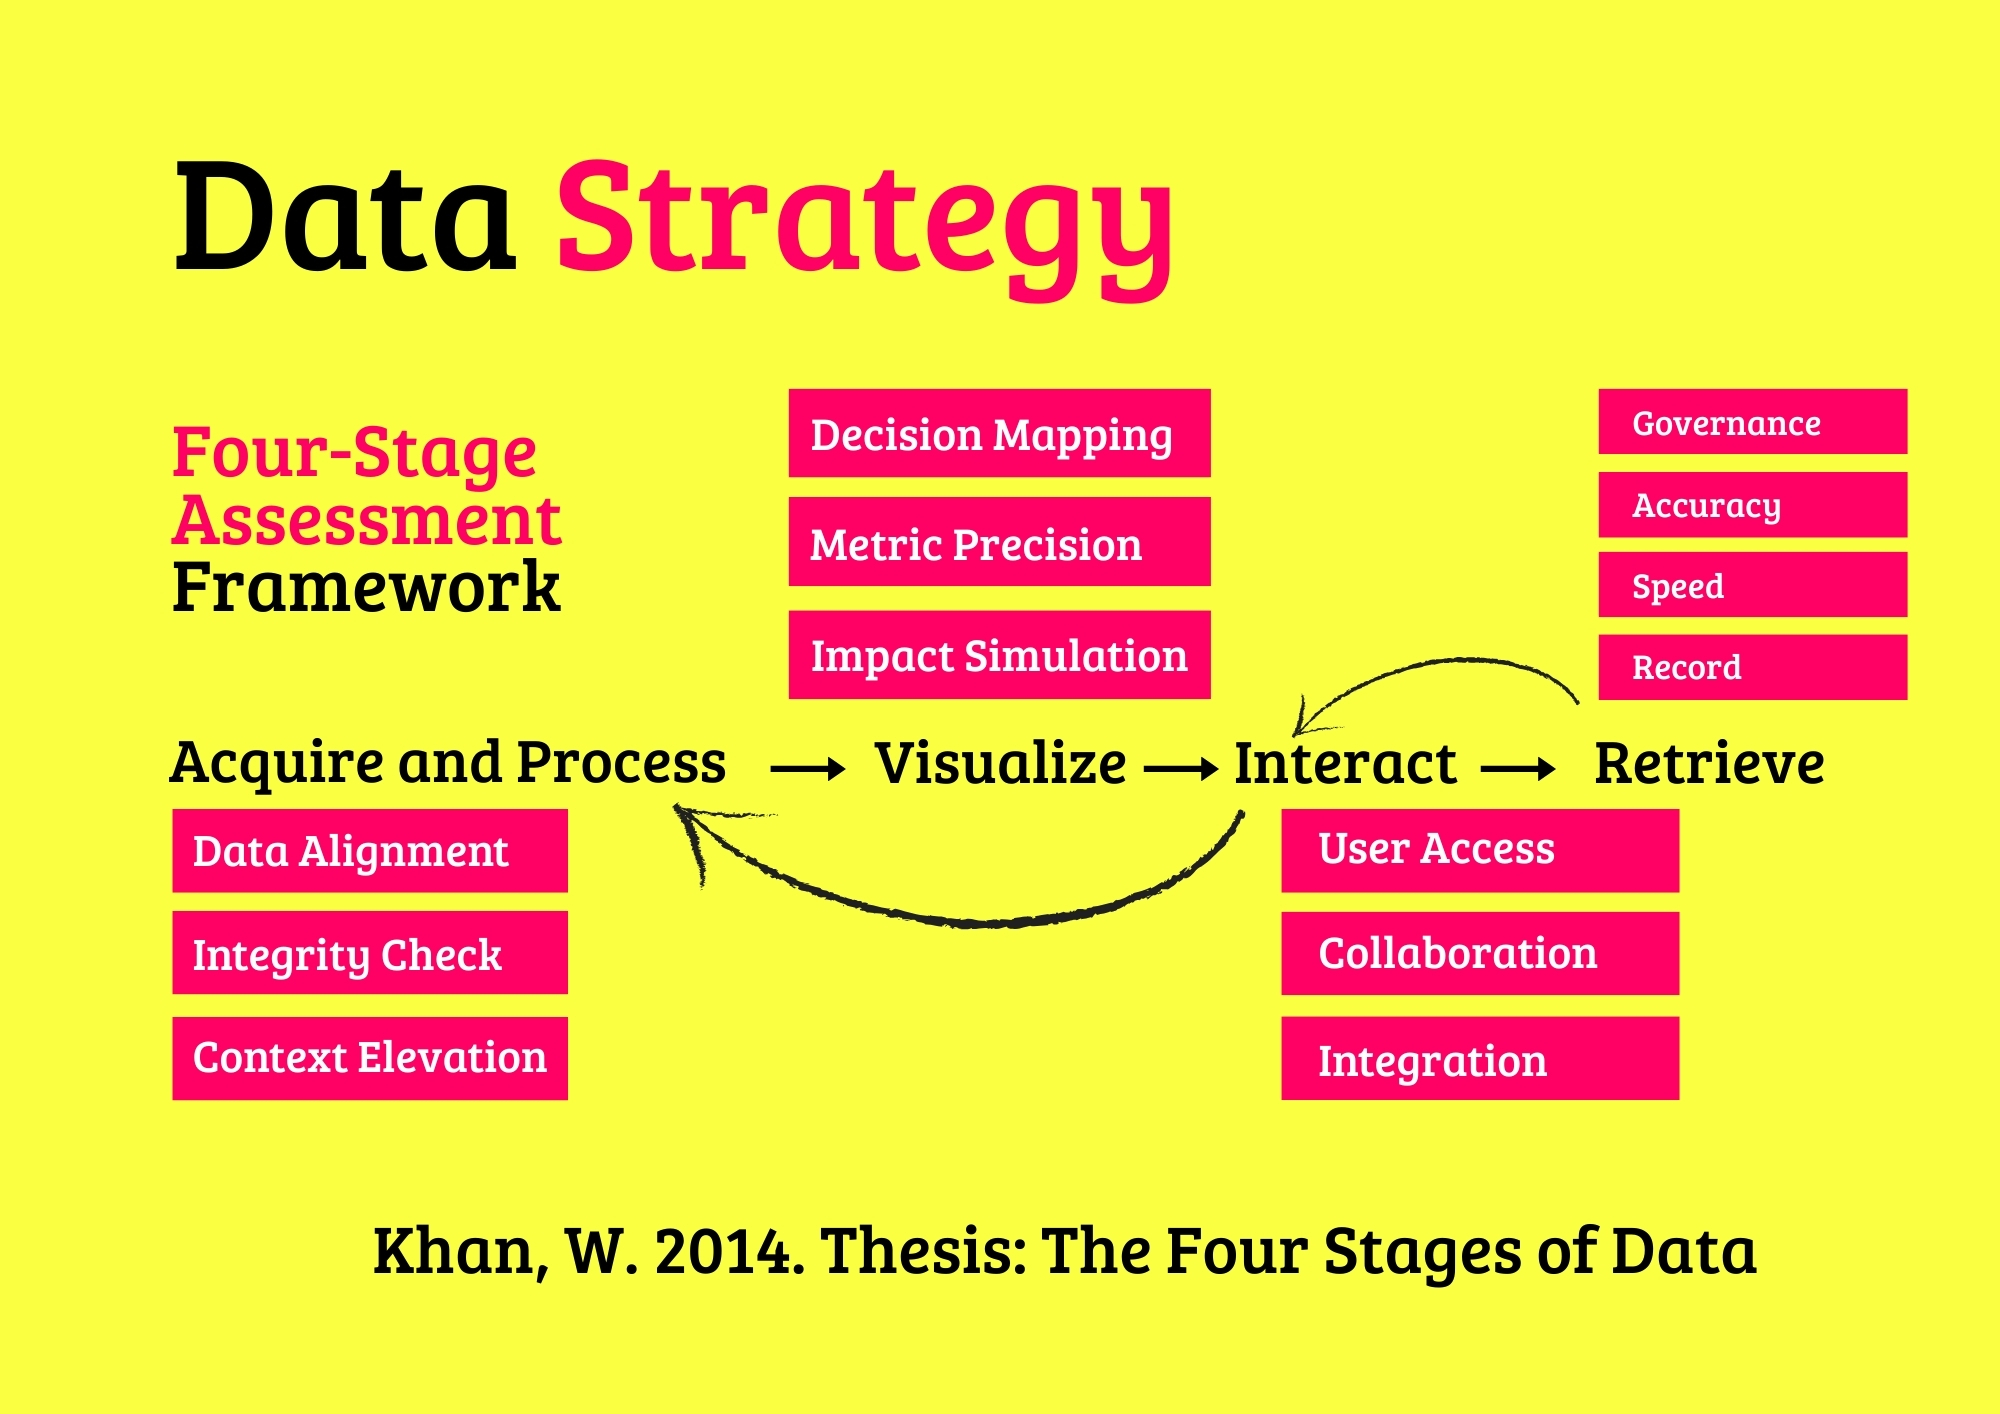
How do you help us acquire data effectively?

We assess your existing data sources and streamline collection using tools like Excel, Python, and SQL. Our process ensures clean, structured, and reliable data through automated pipelines, API integrations, and validation techniques tailored to your needs.

What’s involved in visualizing our data?

We design intuitive dashboards in Tableau, Power BI, or Looker, transforming raw data into actionable insights. Our approach includes KPI alignment, interactive elements, and advanced visual techniques to highlight trends, outliers, and opportunities at a glance.

How can we interact with our data?

We build dynamic reports in Power BI or Tableau, enabling real-time exploration. Filter, drill down, or simulate scenarios—allowing stakeholders to engage with data directly and uncover answers independently.

How do you ensure we can retrieve data quickly?

We optimize storage and queries using Looker’s semantic models, Qlik’s indexing, or cloud solutions like Snowflake. Techniques such as caching and partitioning ensure milliseconds-fast access to critical insights.

How do you assess our data strategy?

We evaluate your goals, data maturity, and gaps using frameworks like Qlik or custom scorecards. From acquisition to governance, we map a roadmap that aligns with your business impact and ROI.

What does Data Engineering entail for acquisition?

We design scalable ETL/ELT pipelines to automate data ingestion from databases, APIs, and cloud platforms. This ensures seamless integration into your systems (e.g., Excel, data lakes) while maintaining accuracy and reducing manual effort.

How do Insights and Analytics use visualization?

Beyond charts, we layer statistical models and trends into Tableau or Power BI dashboards. This turns complex datasets into clear narratives, helping teams spot patterns, correlations, and actionable strategies.

Can Data Visualisation improve interaction?

Yes. Our interactive Power BI/Tableau reports let users filter, segment, and explore data in real time. This fosters data-driven decisions by putting exploration tools directly in stakeholders’ hands.

How do you secure data during retrieval?

We implement encryption (in transit/at rest), role-based access controls (RBAC), and audit logs via Looker or Microsoft Purview. Regular penetration testing ensures compliance with GDPR, CCPA, or industry standards.

How does Machine Learning enhance data interaction?

We integrate ML models into platforms like Qlik or Power BI, enabling users to interact with predictions (e.g., customer churn, sales forecasts) and simulate "what-if" scenarios for proactive planning.

What do AI and Data Workshops teach about acquisition?

Our workshops train teams in practical data acquisition using Excel, Python, and Tableau. Topics include validation, transformation, and automation—equipping your staff with skills to handle real-world data challenges.

How do you assess which tools fit our data stages?

We analyze your workflow across acquisition, storage, analysis, and visualization. Based on your needs, we recommend tools like Power BI (visuals), Looker (modeling), or Qlik (indexing) to optimize each stage.

Can you evaluate our data retrieval speed?

Yes. We audit query performance, database design, and network latency. Solutions may include Qlik’s in-memory processing, indexing, or migrating to columnar databases for near-instant insights.

How do ongoing assessments improve visualization?

We periodically review dashboards to refine UI/UX, optimize load times, and incorporate new data sources. This ensures visuals remain relevant, performant, and aligned with evolving business goals.

Central Limit Theorem

The Central Limit Theorem makes sample averages bell-shaped, powering reliable predictions.

Lena

Lena

Statistician

Neural Network Surge

Neural networks, with billions of connections, drive AI feats like real-time translation.

Eleane

Eleane

AI Researcher

Vector Spaces

Vector spaces fuel AI algorithms, enabling data transformations for machine learning.

Edmond

Edmond

Mathematician

Zettabyte Era

A zettabyte of data—10^21 bytes—flows yearly, shaping AI and analytics globally.

Sophia

Sophia

Data Scientist

NumPy Speed

NumPy crunches millions of numbers in milliseconds, a backbone of data science coding.

Kam

Kam

Programmer

Decision Trees

Decision trees split data to predict outcomes, simplifying choices in AI models.

Jasmine

Jasmine

Data Analyst

ChatGPT Impact

ChatGPT’s 2022 debut redefined AI, answering queries with human-like fluency.

Jamie

Jamie

AI Engineer

ANOVA Insights

ANOVA compares multiple groups at once, revealing patterns in data experiments.

Julia

Julia

Statistician

Snowflake Scale

Snowflake handles petabytes of cloud data, speeding up analytics for millions.

Felix

Felix

Data Engineer

BERT’s Language Leap

BERT understands context in text, revolutionizing AI search and chat since 2018.

Mia

Mia

AI Researcher

Probability Theory

Probability theory quantifies uncertainty, guiding AI decisions in chaotic systems.

Paul

Paul

Mathematician

K-Means Clustering

K-Means groups data into clusters, uncovering hidden trends in markets and more.

Emilia

Emilia

Data Scientist

TensorFlow Reach

TensorFlow builds AI models for millions, from startups to global tech giants.

Danny

Danny

Programmer

Power BI Visuals

Power BI turns raw data into visuals, cutting analysis time by 60% for teams.

Charlotte

Charlotte

Data Analyst

YOLO Detection

YOLO detects objects in real time, enabling AI vision in drones and cameras.

Squibb

Squibb

AI Engineer

Standard Deviation

Standard deviation measures data spread, a universal metric for variability.

Sam

Sam

Statistician

Calculus in AI

Calculus optimizes AI by finding minima, shaping models like neural networks.

Larry

Larry

Mathematician

Airflow Automation

Airflow orchestrates data workflows, running billions of tasks for analytics daily.

Tabs

Tabs

Data Engineer

Reinforcement Learning

Reinforcement learning trains AI through rewards, driving innovations like self-driving cars.

Mitchell

Mitchell

AI Researcher

Join over 2K+ data enthusiasts mastering insights with us.
Lena
Eleane
Edmond
Sophia
Kam
Jasmine
Jamie
Julia
Felix
Mia
Paul
Emilia
Danny
Charlotte
Squibb
Sam
Larry
Tabs
Mitchell
Data value transformation process

Data Stuck in Spreadsheets? Unlock Its $1M Potential in 90 Days

87% of companies underutilize their data assets (Forrester). Caspia's proven 3-phase AI advisory framework:

Diagnose hidden opportunities in your data
Activate AI-powered automation
Scale insights across your organization

Limited capacity - Book your assessment now.

Get Our ROI Calculator